Morpheus 2.2 Release Notes
At the core of this new release, we’ve stepped up to Qt5 and turned that technology into a number of new functionalities for the Morpheus GUI. As a user, composing, navigating and editing your (even larger) models now becomes so much easier.
Along these workflow improvements, we have also extended the online courses on our website (taking online much of our material from summer schools or tutorials in the pre-COVID-19 era), extended OpenMP parallelization to Mappers and Reporters for further performance improvements and made the MorpheusML language and solver capabilities even more flexible, including for instance expressions for lattice size.
We also welcomed new contributors to the development team and are grateful to our users for intense discussions in the user forum – thank you all and enjoy the new Morpheus!
In the following, we’ll highlight some of the new functionalities of the GUI from the perspective of a modeller and assume some basic familiarity with Morpheus, otherwise please also consult the other sections of our homepage. Screenshots reflect the experience under Ubuntu Linux.
Table of Contents
GUI
Model Graph
Interactive
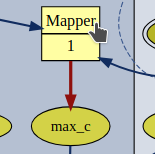
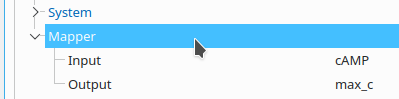
The interactive and configurable model graph acts as the central dashboard and shows the entire model structure. It is displayed in the model‘s Description panel. The model elements displayed on the model graph act as links (mouse arrow turns into hand icon when hovering over an editable model element) to the corresponding element‘s model editor view with that element selected.
Configurable
Your models can grow large and you may need to focus on submodels one by one. In the following, this will be illustrated with the (moderately sized) built-in Example Dictyostelium. Ctrl-mouse wheel allows to zoom the model graph in and out. Sliders allow to pan.
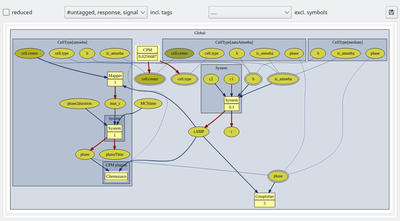
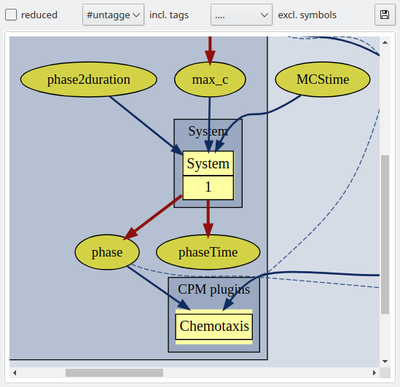
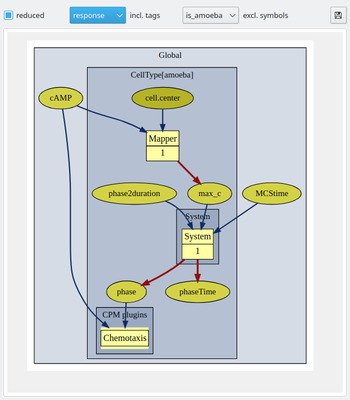
A control bar above the model graph allows to configure the graph by displaying or hiding of model elements. Checking the reduced box simplifies the model graph by hiding all Analysis components as these do not affect the model dynamics and by hiding the component captions (component’s name attributes). Also, all internally complemented model elements, e.g. for mapping variables from different spatial scopes, are hidden.
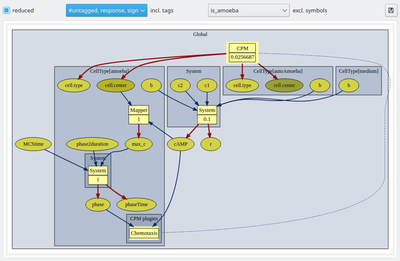
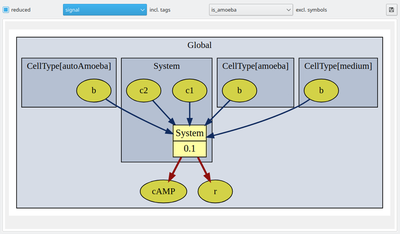
Further, you may now use tags (see below) to group and toggle on/off the display of individual model elements. We have here tagged the extracellular cAMP dynamics with the tag ‘signal’ and the intracellular plugins with the tag ‘response’ such that we can focus on the respective submodels including the immediately associated input and output elements.
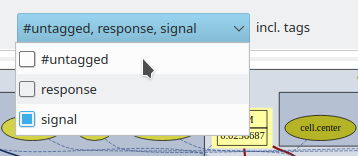
Checkboxes for all individual tags, including the default #untagged, allow to show/hide any combination of user-defined tags. To the right of the tag selection menu, individual model symbols can be hidden from the graph without tagging.
The save icon lets you save an SVG file or PNG rendering of the current view of the model graph. All configuration settings for the model graph are stored in the model‘s XML file and therefore persist upon close/open. These settings can also be changed through attributes for the plugin ModelGraph under Analysis.
Tags
For Model Elements
Tags shall improve the readability and navigation of larger models by denoting logical relations among model elements like ‘hypothetical_interaction_A’ versus ‘hypothetical_interaction_B’. Large models also tend to be composed of submodels or modules. The corresponding subsets of model elements can be grouped and then visualized as submodels (see above) using submodel-specific tags.
Tags is an optional attribute field in the model editor.
For Imported SBML (Sub)Models
When importing (sub)models from SBML files, all imported model elements can be tagged at once by existing (‘response’ in the screenshot) and/or new (‘cAMP_sensing’ in the screenshot) tags.
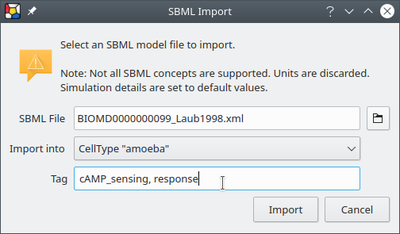
The SBML import dialog (see screenshot), since the previous release, also offers a drop-down list of target options for the imported (sub)model, i.e.
- initialize a new model and import into the
Globalscope, - initialize a new model with a new
CellTypeand import into theCellTypescope, - merge the imported SBML model with the currently active model (as per selection in
Documentspanel) by importing into theGlobalscope of the active model, - as 3. but adding a new
CellTypeand importing therein, - and of most interest, import into an existing
CellType, selectable from a list, of the active model.
Model Editor
View Options
The model editor panel had previously listed all included model elements (corresponding to the model section selected in the Documents panel) in the freely user-defined order which also controls the order of declarations in the model‘s XML file. This remains the default view and you may drag model elements up and down to customize the order, typically to ease navigation.
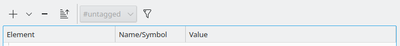
Now, there are two additional view modes and a new options bar immediately above the editor panel. For all three view modes, the + and – buttons allow to add and delete model elements just like the edit commands offered from the mouse context menu (right click).
Sorting of Model Components
The options bar continues with the sort-button and the filter section. The sort button will toggle between the user-sorted order reflecting the order of declarations in the model‘s XML file and alpha-numerically sorted display order. Each column header can then be clicked to sort that column A-Z vs. Z-A. An icon for sort direction is displayed in the ruling column header. You may use this display mode to sort (hence group) the element column or symbol names by alphabet or the value column by size (and letters after numbers). The sort-icon in the options bar shows if sort mode is active.
Filter for Model Components
In analogy, the filter icon further right can be used to toggle between full model display and subset display, filtered by tags. The tags to be included can be ticked from a drop-down menu of the available tags and be freely combined. The default tag #untagged collects all elements without user defined tags.
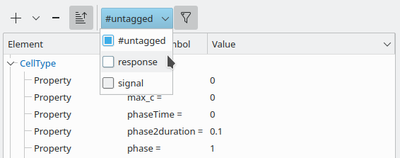
These filter options control what parts of the unchanged model are displayed while the non-displayed parts of the model remain enabled and influence the model dynamics.
To (reversably) disable individual model components (including all child components for plugins like System), you can right-click and select Disable from the context menu. This needs to be done one element at the time and cannot yet be done for all elements with the same tag at once (as we cannot guarantee that the model remains meaningful – but we plan to automate this check in a future release to then provide group enable/disable options.)
Annotation for Model Elements
Each model element now offers an optional Annotation attribute which holds multi-line free text. These annotations may be used for MIRIAM meta data, like Uniform Resource Identifiers (URIs) for RDF as well as non-RDF annotations.
MorpheusML
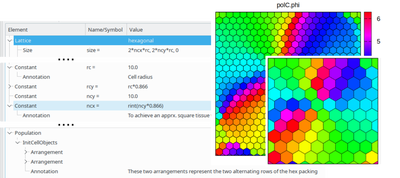
Following Morpheus’ expression everywhere paradigm, lattice size now can also be specified through constant expressions, e.g. to let a global constant (potentially being automatically stepped by ParameterSweep) control the number or size of initialized cells together with the required lattice space to host those cells, and there are plenty of other use cases. The configurable hexagonal cells tissue below illustrates how a scenario can be scaled in size and resolution via global variables. Stay tuned for an upcoming blog post providing more detail.
After having enabled the use of local symbols (e.g. CellPropertyName.local) in the input expression of the Neighborhood(Vector)Reporter for calculating relative neighbor interactions and allowing constant expressions in time-step specifications already in the previous release, the model declaration language has now become even more flexible:
AddCellacceptsCountinstead ofConditionas the number of cells to be placed.ClusterTrackercan cluster cells of multiple cell types.Logger- gained support for conditional logging using
Logger/Restrictions/@condition, - learned to use discrete colors for integer data.
- gained support for conditional logging using
Gnuplotter- allows to set a z-slice per
Plot, alsoArrowsandLabelsfollow the z-slice filter. - Cell opacity moved to
Plot/Cells/@opacity.
- allows to set a z-slice per
- Added
PopulationsInitVectorPropertywith optional spherical notation and theVectorMapper. - Contact energies now support expressions with access to symbols of involved cells.
- The space symbol (
Space/SpaceSymbol) now always provides the location in orthogonal coordinates, also on hexagonal lattices. - Added
@tagsandAnnotationnodes to all model components. - Morpheus registers the URL scheme
morpheus://...to simplify referring to models in web resources, e.g. clicking on a MorpheusML file on a website can directly open that model in Morpheus’ GUI.