Differential Adhesion: Cell Sorting in Two Dimensions
Persistent Identifier
Use this permanent link to cite or share this Morpheus model:
Glazier-Graner Model of cell sorting
Introduction
This model shows the original cellular Potts model (a.k.a. Glazier-Graner model) of cell sorting based on the Steinberg’s differential adhesion hypothesis.
Description
Two CellTypes are defined, each of which has a VolumeConstraint specifying the cell’s target area/volume. In the CPM element, the MetropolisKinetics can be configured and the Interaction energies between cell types are specified.
Results
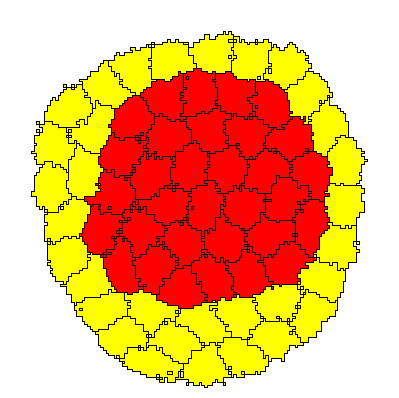
The simulation shows two Populations of spatially resolved cells, 32 red cells of type ct1 and 32 yellow cells of type ct2, that initially are organized in a mosaic fashion, specifically in a checkerboard pattern that is initialized using InitCellObjects. As time progresses, through differential adhesion, the motile cells sort out and reorganize into a distribution in which one cell type engulfes the other.
CellSorting_2D.xml
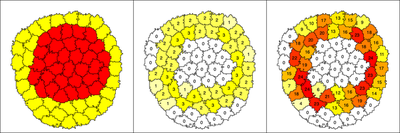
CellTypes ct1 (red) and ct2 (yellow). Middle: Number of neighbors $b$ of the other CellType, colors are scaled from white to yellow to red, representing a low (white), medium (yellow) or high (red) number of neighboring cells. Right: Contact length $b_2$ with cells of the other CellType, with colors indicating a low (white), medium (yellow) or high (red) sum of boundary nodes. These latter two plots only show observables that each cell can report about its respective local neighborhood, and these values are not used in the sorting mechanism.
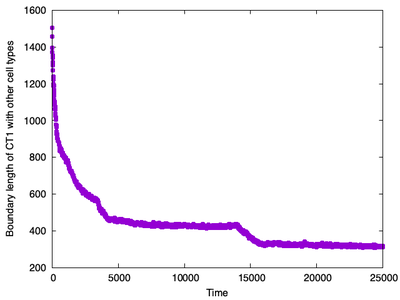
boundary lengths over time between cell types ct1 and ct2. The plot shows an initial rapid decrease followed by a more gradual decline in boundary length as the engulfment progresses.
Snapshots of the simulation can be saved to files named [Title][Time].xml.gz using the SaveInterval component, which is by default disabled in CellSorting_2D.xml. These files containing intermediate and result states can be opened and used as initial conditions for new simulations.
Instead of initializing cells as single points, e.g. with the InitCellObjects or InitCircle plugin, the restored results of a previous simulation explicitely specify the Nodes of each Cell in the CellPopulations.
Remember to change StartTime and StopTime accordingly.
Reference
This model reproduces a published result, originally obtained with a different simulator:
F. Graner, J. A. Glazier: Simulation of biological cell sorting using a two-dimensional extended Potts model. Phys. Rev. Lett. 69 (13): 2013-2016, 1992.
Model
Examples → CPM → CellSorting_2D.xml or
CellSorting_2D.xml
XML Preview
<MorpheusModel version="4">
    <Description>
        <Title>M0021 Cell Sorting 2D</Title>
        <Details>Model ID:	https://identifiers.org/morpheus/M0021
  File type:	–
  Software:	Morpheus (open source). Download from: https://morpheus.gitlab.io
Full title:	Differential Adhesion: Cell Sorting in Two Dimensions
Authors:	F. Graner, J. A. Glazier
Submitters:	W. de Back
Curators:	D. Jahn
Date:	06.11.2019
Units:	[time] = N/A
	[space] = N/A
Reference:	F. Graner, J. A. Glazier: Simulation of biological cell sorting using a two-dimensional extended Potts model. Phys. Rev. Lett. 69 (13): 2013-2016, 1992.
Comment:	–</Details>
    </Description>
    <Global>
        <Variable symbol="boundary" name="Boundary length of ct1 with other cell types" value="0.0"/>
        <Constant symbol="b" value="0.0"/>
        <Constant symbol="b2" value="0.0"/>
    </Global>
    <Space>
        <SpaceSymbol symbol="l"/>
        <Lattice class="square">
            <Size symbol="size" value="150, 150, 0"/>
            <BoundaryConditions>
                <Condition type="periodic" boundary="x"/>
                <Condition type="periodic" boundary="y"/>
            </BoundaryConditions>
            <Neighborhood>
                <Order>2</Order>
            </Neighborhood>
        </Lattice>
    </Space>
    <Time>
        <StartTime value="0"/>
        <StopTime value="2.5e4"/>
        <!--    <Disabled>
        <SaveInterval value="5e3"/>
    </Disabled>
-->
        <RandomSeed value="0"/>
        <TimeSymbol symbol="time"/>
    </Time>
    <CellTypes>
        <CellType class="biological" name="ct1">
            <VolumeConstraint target="200" strength="1"/>
            <NeighborhoodReporter>
                <Input scaling="length" value="cell.type == celltype.ct2.id"/>
                <Output symbol-ref="boundary" mapping="sum"/>
            </NeighborhoodReporter>
            <Property symbol="b" value="0"/>
            <NeighborhoodReporter>
                <Input scaling="cell" value="cell.type == celltype.ct2.id"/>
                <Output symbol-ref="b" mapping="sum"/>
            </NeighborhoodReporter>
            <NeighborhoodReporter>
                <Input scaling="length" value="cell.type == celltype.ct2.id"/>
                <Output symbol-ref="b2" mapping="sum"/>
            </NeighborhoodReporter>
            <Property symbol="b2" name="Interface with ct2" value="0"/>
        </CellType>
        <CellType class="biological" name="ct2">
            <VolumeConstraint target="200" strength="1"/>
            <Property symbol="b" value="0"/>
            <NeighborhoodReporter>
                <Input scaling="cell" value="cell.type == celltype.ct1.id"/>
                <Output symbol-ref="b" mapping="sum"/>
            </NeighborhoodReporter>
            <Property symbol="b2" name="Interface with ct1" value="0"/>
            <NeighborhoodReporter>
                <Input scaling="length" value="cell.type == celltype.ct1.id"/>
                <Output symbol-ref="b2" mapping="sum"/>
            </NeighborhoodReporter>
        </CellType>
        <CellType class="medium" name="medium"/>
    </CellTypes>
    <CPM>
        <Interaction default="0.0">
            <Contact type1="ct1" type2="medium" value="16"/>
            <Contact type1="ct2" type2="medium" value="6"/>
            <Contact type1="ct1" type2="ct1" value="4"/>
            <Contact type1="ct2" type2="ct2" value="4"/>
            <Contact type1="ct1" type2="ct2" value="8"/>
        </Interaction>
        <MonteCarloSampler stepper="edgelist">
            <MCSDuration value="1"/>
            <Neighborhood>
                <Order>2</Order>
            </Neighborhood>
            <MetropolisKinetics temperature="2"/>
        </MonteCarloSampler>
        <ShapeSurface scaling="norm">
            <Neighborhood>
                <Order>6</Order>
            </Neighborhood>
        </ShapeSurface>
    </CPM>
    <CellPopulations>
        <Population type="ct1" size="16">
            <Annotation>Checkerboard pattern: Lower left grid of ct1 cells</Annotation>
            <InitCellObjects mode="distance">
                <Arrangement displacements="30, 30, 1" repetitions="4, 4, 1">
                    <Box origin="15, 15, 0" size="15, 15, 0"/>
                </Arrangement>
            </InitCellObjects>
        </Population>
        <Population type="ct1" size="16">
            <Annotation>Checkerboard pattern: Upper right grid of ct1 cells</Annotation>
            <InitCellObjects mode="distance">
                <Arrangement displacements="30, 30, 1" repetitions="4, 4, 1">
                    <Box origin="30, 30, 0" size="15, 15, 0"/>
                </Arrangement>
            </InitCellObjects>
        </Population>
        <Population type="ct2" size="16">
            <Annotation>Checkerboard pattern: Upper left grid of ct2 cells</Annotation>
            <InitCellObjects mode="distance">
                <Arrangement displacements="30, 30, 1" repetitions="4, 4, 1">
                    <Box origin="15, 30, 0" size="15, 15, 0"/>
                </Arrangement>
            </InitCellObjects>
        </Population>
        <Population type="ct2" size="16">
            <Annotation>Checkerboard pattern: Lower right grid of ct2 cells</Annotation>
            <InitCellObjects mode="distance">
                <Arrangement displacements="30, 30, 1" repetitions="4, 4, 1">
                    <Box origin="30, 15, 0" size="15, 15, 0"/>
                </Arrangement>
            </InitCellObjects>
        </Population>
        <!--    <Disabled>
        <Population type="ct1" size="0">
            <Annotation>Alternative random initialization of ct1 cells</Annotation>
            <InitCircle number-of-cells="32" mode="random">
                <Dimensions radius="size.x/3" center="size.x/2, size.y/2, 0"/>
            </InitCircle>
        </Population>
    </Disabled>
-->
        <!--    <Disabled>
        <Population type="ct2" size="0">
            <Annotation>Alternative random initialization of ct2 cells</Annotation>
            <InitCircle number-of-cells="32" mode="random">
                <Dimensions radius="size.x/3" center="size.x/2, size.y/2, 0"/>
            </InitCircle>
        </Population>
    </Disabled>
-->
    </CellPopulations>
    <Analysis>
        <Gnuplotter time-step="100" decorate="false">
            <Terminal name="png"/>
            <Plot>
                <Cells flooding="true" value="cell.type"/>
            </Plot>
            <Plot>
                <Cells flooding="true" value="b">
                    <ColorMap>
                        <Color value="2" color="red"/>
                        <Color value="1" color="yellow"/>
                        <Color value="0" color="white"/>
                    </ColorMap>
                </Cells>
                <CellLabels fontsize="10" precision="0" value="b"/>
            </Plot>
            <Plot>
                <Cells per-frame-range="true" value="b2">
                    <ColorMap>
                        <Color value="2" color="red"/>
                        <Color value="1" color="yellow"/>
                        <Color value="0" color="white"/>
                    </ColorMap>
                </Cells>
                <CellLabels fontsize="10" precision="0" value="b2"/>
            </Plot>
        </Gnuplotter>
        <Logger time-step="10.0">
            <Input>
                <Symbol symbol-ref="boundary"/>
                <Symbol symbol-ref="b"/>
                <Symbol symbol-ref="b2"/>
            </Input>
            <Output>
                <TextOutput/>
            </Output>
            <Plots>
                <Plot time-step="500">
                    <Style style="linespoints"/>
                    <Terminal terminal="png"/>
                    <X-axis>
                        <Symbol symbol-ref="time"/>
                    </X-axis>
                    <Y-axis>
                        <Symbol symbol-ref="boundary"/>
                    </Y-axis>
                </Plot>
            </Plots>
        </Logger>
        <ModelGraph format="dot" reduced="false" include-tags="#untagged"/>
    </Analysis>
</MorpheusModel>

Downloads
Files associated with this model: