ODE Model: Cell Cycle
Persistent Identifier
Use this permanent link to cite or share this Morpheus model:
Introduction
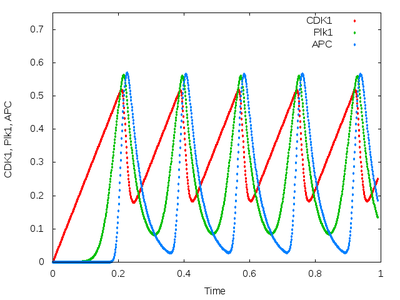
This model is a simple three-species ODE model of the Xenopus embryonic cell cycle (Ferrell et al., 2011). It exhibits sustained limit cycle oscillations.
Description
One CellType is created that has three variables of Properties representing the concentrations of $\mathrm{APC}$, $\mathrm{Plk1}$, and $\mathrm{CDK1}$. These variables are coupled in a System of DiffEqns.
In the System, a number of Constants are defined, whose symbols are used in the DiffEqn. Note that the equations are entered in simple plain text.
The System uses the runga-kutta (4th order) solver for the differential equations and speficies a particular time step (here $ht = 10^{-2}$) which is interpreted in global time steps.
The global time is defined in the Time element and runs from StartTime to StopTime ($0$ to $25$). In this non-spatial model, Space defines a Lattice of size $(x,y,z)=(1,1,0)$.
Results are written to a file using the Analysis plugin Logger. The Logger also visualizes the time plot to screen (in interactive mode) or to PNG files (in local mode).
Things to try
- Change the dynamics by altering
System/time-scaling.
Reference
J. E. Ferrell Jr., T. Y. Tsai, Q. Yang: Modeling the Cell Cycle: Why Do Certain Circuits Oscillate?. Cell 144 (6): 874-885, 2011.
Model
Examples → ODE → CellCycle.xml or
CellCycle.xml
XML Preview
<?xml version='1.0' encoding='UTF-8'?>
<MorpheusModel version="3">
    <Description>
        <Title>Example-CellCycle</Title>
        <Details>James Ferrell, Tony Yu-Chen Tsai and Qiong Yang (2011) Modeling the Cell Cycle: Why Do Certain Circuits Oscillate?, Cell 144, p874-885. http://dx.doi.org/10.1016/j.cell.2011.03.006</Details>
    </Description>
    <Global/>
    <Space>
        <Lattice class="square">
            <Size symbol="size" value="1,1,0"/>
            <Neighborhood>
                <Order>1</Order>
            </Neighborhood>
        </Lattice>
        <SpaceSymbol symbol="space"/>
    </Space>
    <Time>
        <StartTime value="0"/>
        <StopTime value="25"/>
        <TimeSymbol symbol="time"/>
    </Time>
    <CellTypes>
        <CellType class="biological" name="cells">
            <Property symbol="APC" value="0"/>
            <Property symbol="Plk1" value="0"/>
            <Property symbol="CDK1" value="0"/>
            <System solver="runge-kutta" time-scaling="1" time-step="1e-2">
                <Constant symbol="n" value="8"/>
                <Constant symbol="K" value="0.5"/>
                <Constant symbol="α1" value="0.1"/>
                <Constant symbol="α2" value="3.0"/>
                <Constant symbol="α3" value="3.0"/>
                <Constant symbol="β1" value="3.0"/>
                <Constant symbol="β2" value="1.0"/>
                <Constant symbol="β3" value="1.0"/>
                <DiffEqn symbol-ref="CDK1">
                    <Expression>α1 - β1 * CDK1 * (APC^n) / (K^n + APC^n)</Expression>
                </DiffEqn>
                <DiffEqn symbol-ref="Plk1">
                    <Expression>α2*(1-Plk1) * ((CDK1^n) / (K^n + CDK1^n)) - β2*Plk1</Expression>
                </DiffEqn>
                <DiffEqn symbol-ref="APC">
                    <Expression>α3*(1- APC) * ((Plk1^n) / (K^n + Plk1^n)) - β3*APC</Expression>
                </DiffEqn>
            </System>
        </CellType>
    </CellTypes>
    <CellPopulations>
        <Population size="0" type="cells">
            <InitCellLattice/>
        </Population>
    </CellPopulations>
    <Analysis>
        <Logger time-step="1e-2">
            <Restriction>
                <Celltype celltype="cells"/>
            </Restriction>
            <Input>
                <Symbol symbol-ref="APC"/>
                <Symbol symbol-ref="CDK1"/>
                <Symbol symbol-ref="Plk1"/>
            </Input>
            <Output>
                <TextOutput file-format="csv"/>
            </Output>
            <Plots>
                <Plot time-step="-1">
                    <Style style="lines" line-width="4.0"/>
                    <Terminal terminal="png"/>
                    <X-axis>
                        <Symbol symbol-ref="time"/>
                    </X-axis>
                    <Y-axis>
                        <Symbol symbol-ref="APC"/>
                        <Symbol symbol-ref="CDK1"/>
                        <Symbol symbol-ref="Plk1"/>
                    </Y-axis>
                </Plot>
                <Plot time-step="-1">
                    <Style style="lines" line-width="4.0"/>
                    <Terminal terminal="png"/>
                    <X-axis>
                        <Symbol symbol-ref="CDK1"/>
                    </X-axis>
                    <Y-axis>
                        <Symbol symbol-ref="APC"/>
                    </Y-axis>
                    <Color-bar>
                        <Symbol symbol-ref="Plk1"/>
                    </Color-bar>
                </Plot>
            </Plots>
        </Logger>
    </Analysis>
</MorpheusModel>
Downloads
Files associated with this model: