Blastocyst Development
Persistent Identifier
Use this permanent link to cite or share this Morpheus model:
How does the single zygote transform into a 128-cell stage?
Introduction
This project aims to simulate the development of a human embryo from a single zygote cell to the 128-cell stage using a Cellular Potts Model (CPM). The simulation accounts for various biological processes, including cell sorting, differentiation, and division, influenced by adhesion forces, cellular signaling, and chemical fields.
Description
Mathematical details of the gene expression and cellular differentiation processes are based on the models described in Cang et al., 2021 (with code at GitHub) and in De Mot et al., 2016.
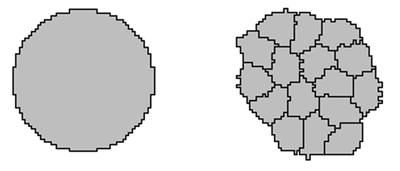
1-cell to 16-cell Stage
At the initial stage, zygote cells divide and form a berry-shaped cluster called a morula. The cells express two mutually exclusive genes, Cdx2 and Oct4, regulated by cell-cell contact. The model uses ordinary differential equations (ODEs) with Hill functions to represent these genetic expressions and their mutual inhibition.
Key Features
- Strong adhesion forces
- Cellular division along the minor axis
- Differentiation into the inner cell mass (ICM) and trophectoderm (TE)
Mathematical Model
The ODEs governing the mutually exclusive genetic expressions of Oct4 and Cdx2 are given by:
$$\begin{align} \small \frac{\mathrm{d}[\text{Oct}]_i}{\mathrm{d}t} \ &\small= k _\text{o} \left( b _\text{o} + a _\text{o} \frac{[\text{Oct}]^n_i}{\theta^n _\text{o} + [\text{Oct}]^n_i} \right) \left( 1 + I _\text{co} \frac{\theta ^n _\text{c}}{\theta^n _\text{c} +[\text{Cdx}]^n_i} \right) - d _\text{o}[\text{Oct}]_i \\ \small \frac{\mathrm{d}[\text{Cdx}]_i}{\mathrm{d}t} \ &\small= k _\text{c} \left( b _\text{c} + S_i + a _\text{c} \frac{[\text{Cdx}]^n_i}{\theta^n _\text{c} + [\text{Cdx}]^n_i} \right) \left(1 + I _\text{oc} \frac{\theta^n _\text{o}}{\theta ^n _\text{o} + [\text{Oct}]^n_i} \right) - d _\text{c}[\text{Cdx}]_i \end{align}$$
Where $([\text{Oct}]_i)$ and $([\text{Cdx}]_i)$ represent the concentration of Oct4 and Cdx2 expression levels in the $(i^{\text{th}})$ cell, respectively. $(S_i)$ is proportional to the percentage of the zygote cell in contact with other zygotes.
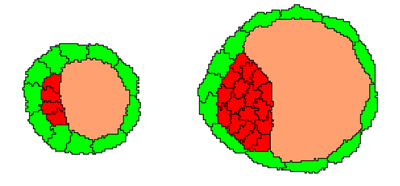
16-cell to 32-cell Stage
As the embryo progresses, it consists of TE cells surrounding the ICM and a blastocoel cavity. TE cells prevent fluid loss and promote the formation of the blastocoel. Cellular differentiation continues with GATA6 and NANOG expression, guided by FGF4 signaling.
Key Features
- Formation of TE and ICM cells
- Incorporation of FGFR2 receptors and ERK signaling pathways
- Differentiation driven by spatial and chemical cues
Mathematical Model
The model for GATA6/NANOG cellular differentiation incorporates additional layers for FGFR2 receptor density, FGF4 ligand secretion, and ERK signaling:
$$\begin{align} \small \frac{\mathrm{d}[\text{G}]_i}{\mathrm{d}t} \ &\small= \left(v\text{sg1} \frac{[\text{ERK}]^r_i}{K\text{ag1}^r + [\text{ERK}]^r_i} + v\text{sg2} \frac{[\text{G}]^s_i}{K\text{ag2}^s+[\text{G}]^s_i} \right) \frac{K\text{ig}^q}{K\text{ig}^q+[\text{N}]^q_i} - k\text{dg}[\text{G}]_i \\ \small \frac{\mathrm{d}[\text{N}]_i}{\mathrm{d}t} \ &\small= \left( v\text{sn1} \frac{K\text{in1}^u}{K\text{in1}^u + [\text{ERK}]^u_i} + v\text{sn2} \frac{[\text{N}]^v_i}{K\text{an}^v+[\text{N}]^v_i} \right) \frac{K\text{in2}^w}{K\text{in2}^w+[\text{G}]^w_i} \\ &\small\quad- k\text{dn}[\text{N}]_i \\ \small \frac{\mathrm{d}[\text{FR}]_i}{\mathrm{d}t} \ &\small= v\text{sfr1} \frac{K\text{ifr}}{K\text{ifr}+[\text{N}]_i} + v\text{sfr2} \frac{[\text{G}]_i}{K\text{afr} + [\text{G}]_i} - k\text{dfr}[\text{FR}]_i \\ \small \frac{\mathrm{d}[\text{ERK}]_i}{\mathrm{d}t} \ &\small= v\text{a}[\text{FR}]_i \frac{[\text{Fp}]_i}{K\text{d} + [\text{Fp}]_i} \frac{1-[\text{ERK}]_i}{K\text{a} + 1 - [\text{ERK}]_i} - v\text{in} \frac{[\text{ERK}]_i}{K\text{i} + [\text{ERK}]_i} \\ \small \frac{\partial [\text{Fs}]_i}{\partial t} \ &\small= D _{\text{Fs}} \frac{\partial ^2 [\text{Fs}]_i}{\partial x^2} + v\text{sf} \frac{[\text{N}]^z_i}{K\text{af}^z + [\text{N}]^z_i} - k\text{df}[\text{Fs}]_i \\ \small F \ &\small= \sum _{i=1}^{n}[\text{Fs}]_i \\ \small [\text{Fp}]_i \ &\small= \frac{1}{[\text{Cell Area}]} \iint _{\text{Cell}} F \ \mathrm{d}A \end{align}$$
Where $([\text{G}]_i)$ and $([\text{N}]_i)$ represent the concentrations of GATA6 and NANOG, $([\text{FR}]_i)$ represents FGFR2 receptor concentration, and $([\text{ERK}]_i)$ is the normalized ERK signaling level.
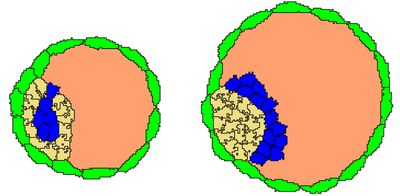
32-cell to 128-cell Stage
Final cellular sorting is essential for the embryo’s success, positioning epiblast (Epi) cells near the TE ring and separating them from the blastocoelic cavity by primitive endoderm (PrE) cells. Adjustments to adhesion energies and cellular properties prevent issues like cell jamming.
Key Features:
- Selective adhesion adjustments
- Avoidance of cell jamming and clustering issues
Results
The simulation results align with experimental data, showing expected patterns of cell differentiation and organization. The project successfully demonstrates the role of cell sorting in embryo development, with further work needed to transition from 2D to 3D models. When the 2D model is interpreted as a cross-section of the embryo, then, especially at late stages like the 128-cell stage, a smaller cell number is contained in any 2D cross-section.
When running the model for 3000 time steps, which can be interpreted as late 128-cell stage, then the emergent cell type ratio of 38.8 ± 8.4 (mean ± SD) PrE cells among ICM can be compared to results from Cang et al., 2021, as visualized in the following figure.
 (**middle**, [*CC BY 4.0*](https://creativecommons.org/licenses/by/4.0/): [**Cang _et al._**](#reference)). However, the two published [Figure 3a](https://doi.org/10.1371/journal.pcbi.1008571.g003) and [Figure 4b](https://doi.org/10.1371/journal.pcbi.1008571.g004) (**right**, [*CC BY 4.0*](https://creativecommons.org/licenses/by/4.0/): [**Cang _et al._**](#reference)) are in conflict as both refer to the same legend, indicating that the color code in [Figure 4b](https://doi.org/10.1371/journal.pcbi.1008571.g004) is wrong.](/media/model/m9999/M9999_blastocyst-development_fig-4_comparison_huc8788272f080c127ae50947a53178dd9_305470_5688689ea10fb1433d488df6114ac42b.png)
Reference
This model reproduces a published result, originally obtained with a different simulator:
Z. Cang, Y. Wang, Q. Wang, K. W. Y. Cho, W. Holmes, Q. Nie: A multiscale model via single-cell transcriptomics reveals robust patterning mechanisms during early mammalian embryo development. PLoS Comput. Biol. 17 (3): e1008571, 2021.
Model
Mammalian_Embryo_Development.xml
XML Preview
<MorpheusModel version="4">
<Description>
<Title>Mammalian Embryo Development</Title>
<Details>Model ID: https://identifiers.org/morpheus/M9999
Software: Morpheus (open source). Download from: https://morpheus.gitlab.io
Full title: Blastocyst Development
Authors: Z. Cang ,Y. Wang , Q. Wang, K. W. Y. Cho, W. Holmes, Q. Nie
Submitters: J. Algorta, L. Edelstein-Keshet
Curators: L. Brusch
Date: 01.10.2024
References: [1] Zixuan Cang, Yangyang Wang, Qixuan Wang, Ken W. Y. Cho, William Holmes, and Qing Nie. A multiscale model via single-cell transcriptomics reveals robust patterning mechanisms during early mammalian embryo development. PLOS Computational Biology, 17(3): e1008571, 2021.
[2] Laurane De Mot, Didier Gonze, Sylvain Bessonnard, Claire Chazaud, Albert Goldbeter, and Geneviève Dupont. Cell fate specification based on tristability in the inner cell mass of mouse blastocysts. Biophysical Journal, 110(3): 710–722, 2016.
Comment: This simulation models the spatial pattern formation during the early stages of mammalian embryo development, from the zygote to the 128-cell stage. It captures two key stages of cellular differentiation: the differentiation of zygote cells into trophectoderm (TE) and inner cell mass (ICM) cells, followed by the differentiation of ICM cells into epiblast (Epi) and primitive endoderm (PrE) cells. Additionally, it includes the formation and expansion of the blastocoel lumen. The model integrates complex genetic regulatory mechanisms described by ordinary differential equations (ODEs), designed to replicate the spatial organization and self-organization processes essential for the further development of the embryo. Mathematical details of the genetic expression and cellular differentiation processes are based on the models described in [1] and [2].</Details>
</Description>
<Global>
<Variable symbol="G" name="Level of expression of GATA6" value="0.0"/>
<Variable symbol="N" name="Level of expression of NANOG" value="0.0"/>
<Variable symbol="FR" name="Level of expression of FGFR2 receptors" value="2.8"/>
<Variable symbol="ERK" name="Level of activity of FGFR/Erk Signaling pathway" value="0.25"/>
<Variable symbol="FP" name="Perceived FGF4" value="0.0"/>
<Constant symbol="vsg1" name="Maximum rate of Gata6 synthesis caused by ERK activation" value="1.202"/>
<Constant symbol="vsg2" name="Maximum rate of GATA6 synthesis caused by its auto-activation " value="1"/>
<Constant symbol="vsn1" name="Basal rate of NANOG synthesis" value="0.856"/>
<Constant symbol="vsn2" name="Maximum rate of NANOG synthesis caused by its auto-activation" value="1"/>
<Constant symbol="vsfr1" name="Basal rate of FGFR2" value="2.8"/>
<Constant symbol="vsfr2" name="Maximum rate of FGFR2 synthesis caused by GATA6 activation" value="2.8"/>
<Constant symbol="vex" name="Basal rate of FGF4 synthesis " value="0.000"/>
<Constant symbol="vsf" name="Maximum rate of FGF4 synthesis caused by NANOG activation" value="0.6"/>
<Constant symbol="va" name="ERK activation rate" value="20"/>
<Constant symbol="vin" name="ERK inactivation rate" value="3.3"/>
<Constant symbol="kdg" name="GATA6 degradation rate" value="1"/>
<Constant symbol="kdn" name="NANOG degradation rate" value="1"/>
<Constant symbol="kdfr" name="FGFR2 degradation rate" value="1"/>
<Constant symbol="kdf" name="FGF4 degradation rate" value="0.09"/>
<Constant symbol="Kag1" name="Threshold constant for the activation of GATA6 synthesis by ERK" value="0.28"/>
<Constant symbol="Kag2" name="Threshold constant for GATA6 auto-activation " value="0.55"/>
<Constant symbol="Kan" name="Threshold constant for NANOG auto-activation" value="0.55"/>
<Constant symbol="Kafr" name="Threshold constant for the activation of FGFR2 synthesis by GATA6" value="0.5"/>
<Constant symbol="Kaf" name="Threshold constant for the activation of FGF4 synthesis by NANOG" value="5"/>
<Constant symbol="Kig" name="Threshold constant for the inhibition of GATA6 synthesis by NANOG" value="2"/>
<Constant symbol="Kin1" name="Threshold constant for the inhibition of NANOG synthesis by ERK" value="0.28"/>
<Constant symbol="Kin2" name="Threshold constant for the inhibition of NANOG synthesis by GATA6 " value="2"/>
<Constant symbol="Kifr" name="Threshold constant for the inhibition of FGFR2 synthesis by NANOG" value="0.5"/>
<Constant symbol="Ka" name="Michaelis constant for activation of the ERK pathway" value="0.7"/>
<Constant symbol="Ki" name="Michaelis constant for inactivation of the ERK pathway" value="0.7"/>
<Constant symbol="Kd" name="Michaelis constant for activation of the ERK pathway by FGF4" value="2"/>
<Constant symbol="r" name="Hill coefficient for the activation of GATA6 synthesis by ERK" value="3"/>
<Constant symbol="s" name="Hill coefficient for GATA6 auto-activation" value="4"/>
<Constant symbol="q" name="Hill coefficient for the inhibition of GATA6 synthesis by NANOG" value="4"/>
<Constant symbol="u" name="Hill coefficient for the inhibition of NANOG synthesis by ERK" value="3"/>
<Constant symbol="v" name="Hill coefficient for NANOG auto-activation " value="4"/>
<Constant symbol="w" name="Hill coefficient for the inhibition of NANOG synthesis by GATA6 " value="4"/>
<Constant symbol="z" name="Hill coefficient for the activation of FGF4 synthesis by NANOG" value="4"/>
<Variable symbol="F" name="Average FGF4 ligand across the cell area" value="0.066"/>
<Field symbol="FS" name="FGF4 ligand chemical field" value="0.">
<Diffusion rate="3"/>
<BoundaryValue boundary="x" value="0."/>
<BoundaryValue boundary="-x" value="0."/>
<BoundaryValue boundary="x" value="0."/>
<BoundaryValue boundary="-y" value="0."/>
</Field>
<System time-step="0.5" name="FGF4 secretion" solver="Runge-Kutta [fixed, O(4)]">
<DiffEqn symbol-ref="FS">
<Expression>(vsf*(N^z/(Kaf^z+N^z))-kdf*FS)</Expression>
</DiffEqn>
</System>
<Constant symbol="k" value="0.32"/>
<Constant symbol="b" value="2"/>
<Constant symbol="a" value="1"/>
<Constant symbol="th" value="0.5"/>
<Constant symbol="i" value="1.5"/>
<Constant symbol="d" value="0.4"/>
<Constant symbol="n" value="4"/>
<Constant symbol="basal" value="0.0"/>
<Constant symbol="same" value="0.0"/>
<Variable symbol="c1" value="1000"/>
<Variable symbol="c2" value="10000"/>
<Event trigger="on-change" name="Reaching 16-cell stage">
<Annotation>This event is used to gather information from when the simulation reaches a total of 16 cells.
Variable c1 saves the time when the 16 stage is reached.</Annotation>
<Condition>total == 16</Condition>
<Rule symbol-ref="c1">
<Expression>time</Expression>
</Rule>
</Event>
<Event trigger="on-change" name="Reaching 32-cell stage">
<Annotation>This event is used to gather information from when the simulation reaches a total of 32 cells.

Variable c2 saves the time when the 32 stage is reached.</Annotation>
<Condition>(total == 32) or (total > 32)</Condition>
<Rule symbol-ref="c2">
<Expression>time</Expression>
</Rule>
</Event>
<Variable symbol="vol.target" value="0.0"/>
<Variable symbol="dc" value="0.0"/>
<Constant symbol="dcm" value="0.0"/>
<Function symbol="total">
<Expression>celltype.Zygote.size+celltype.Epi.size+celltype.PrE.size+celltype.ICM.size+celltype.Troph.size</Expression>
</Function>
</Global>
<Space>
<SpaceSymbol symbol="l"/>
<Lattice class="square">
<Size symbol="size" value="250, 250, 0"/>
<BoundaryConditions>
<Condition type="constant" boundary="x"/>
<Condition type="constant" boundary="y"/>
</BoundaryConditions>
<Neighborhood>
<Order>2</Order>
</Neighborhood>
<NodeLength value="1"/>
</Lattice>
<MembraneLattice>
<Resolution value="100"/>
<SpaceSymbol symbol="mem"/>
</MembraneLattice>
</Space>
<Time>
<StartTime value="0"/>
<StopTime value="3000"/>
<RandomSeed value="0"/>
<TimeSymbol symbol="time"/>
</Time>
<CellTypes>
<CellType class="medium" name="medium"/>
<CellType class="biological" name="ICM">
<VolumeConstraint target="70" strength="1"/>
<SurfaceConstraint target="1" strength="1" mode="aspherity"/>
<Property symbol="G" name="Level of expression of GATA6" value="0"/>
<Property symbol="N" name="Level of expression of NANOG" value="0"/>
<Property symbol="FR" name="Level of expression of FGFR2 receptors" value="2.8"/>
<Property symbol="ERK" name="Level of activity of FGFR/Erk Signaling pathway" value="0.75"/>
<Property symbol="FP" name="Perceived FGF4" value="0.0"/>
<Property symbol="F" name="Average FGF4 ligand across the cell area" value="0.066"/>
<Property symbol="gamma" value="rand_uni(-0.1,0.1)"/>
<Mapper name="sensing the chemical">
<Annotation>Computing the average of the chemical field for FGF4 ligands across the cell.</Annotation>
<Input value="FS"/>
<Output symbol-ref="F" mapping="average"/>
</Mapper>
<System solver="Dormand-Prince [adaptive, O(5)]">
<DiffEqn symbol-ref="G">
<Expression>((vsg1*((ERK^r)/(Kag1^r+ERK^r))+vsg2*((G^s)/(Kag2^s+G^s)))*((Kig^q)/(Kig^q+N^q))-kdg*G)*(time>50)</Expression>
</DiffEqn>
<DiffEqn symbol-ref="N">
<Expression>((vsn1*(Kin1^u/(Kin1^u+ERK^u))+vsn2*(N^v/(Kan^v+N^v)))*(Kig^q/(Kig^q+N^q))-kdn*N)*(time>50)</Expression>
</DiffEqn>
<DiffEqn symbol-ref="FR">
<Expression>(vsfr1*(Kifr/(Kifr+N))+vsfr2*(G/(Kafr+G))-kdfr*FR)*(time>50)</Expression>
</DiffEqn>
<DiffEqn symbol-ref="ERK">
<Expression>(va*FR*(FP/(Kd+FP))*((1-ERK)/(Ka+1-ERK))-vin*(ERK/(Ki+ERK)))*(time>50)</Expression>
</DiffEqn>
<Rule symbol-ref="FP">
<Expression>(1+gamma)*F</Expression>
</Rule>
<Annotation>Equations from DeMot 2016</Annotation>
</System>
<ChangeCellType newCellType="Epi" name="Differentiate to Epiblast">
<Condition> G<0.001 and time>c2</Condition>
<Annotation>c2 is the time when the 32-cell stage is reached </Annotation>
</ChangeCellType>
<ChangeCellType newCellType="PrE" name="Differentiate to Primitive Endoderm">
<Condition>G>0.001 and time>c2</Condition>
<Annotation>c2 is the time when the 32-cell stage is reached </Annotation>
</ChangeCellType>
<CellDivision division-plane="random">
<Condition>(rand_uni(0,1) < 0.001)*(time<c2)</Condition>
<Triggers>
<Rule symbol-ref="G">
<Expression>G/2</Expression>
</Rule>
<Rule symbol-ref="N">
<Expression>N/2</Expression>
</Rule>
<Rule symbol-ref="FR">
<Expression>FR/2</Expression>
</Rule>
<Rule symbol-ref="ERK">
<Expression>ERK/2</Expression>
</Rule>
</Triggers>
<Annotation>Cell division splits the levels of expression in half for each daughter cell</Annotation>
</CellDivision>
<ConnectivityConstraint/>
</CellType>
<CellType class="biological" name="Epi">
<VolumeConstraint target="70" strength="1"/>
<SurfaceConstraint target="1" strength="1" mode="aspherity"/>
<Property symbol="G" name="Level of expression of GATA6" value="0.0"/>
<Property symbol="N" name="Level of expression of NANOG" value="0.0"/>
<Property symbol="FR" name="Level of expression of FGFR2 receptors" value="2.8"/>
<Property symbol="ERK" name="Level of activity of FGFR/Erk Signaling pathway" value="0.25"/>
<Property symbol="FP" name="Perceived FGF4" value="0.0"/>
<Property symbol="F" name="Average FGF4 ligand across the cell area" value="0.066"/>
<Property symbol="gamma" value="rand_uni(-0.1,0.1)"/>
<Mapper name="sensing the chemical">
<Annotation>Computing the average of the chemical field for FGF4 ligands across the cell.</Annotation>
<Input value="FS"/>
<Output symbol-ref="F" mapping="average"/>
</Mapper>
<System solver="Dormand-Prince [adaptive, O(5)]">
<DiffEqn symbol-ref="G">
<Expression>((vsg1*((ERK^r)/(Kag1^r+ERK^r))+vsg2*((G^s)/(Kag2^s+G^s)))*((Kig^q)/(Kig^q+N^q))-kdg*G)</Expression>
</DiffEqn>
<DiffEqn symbol-ref="N">
<Expression>((vsn1*(Kin1^u/(Kin1^u+ERK^u))+vsn2*(N^v/(Kan^v+N^v)))*(Kig^q/(Kig^q+N^q))-kdn*N)</Expression>
</DiffEqn>
<DiffEqn symbol-ref="FR">
<Expression>(vsfr1*(Kifr/(Kifr+N))+vsfr2*(G/(Kafr+G))-kdfr*FR)</Expression>
</DiffEqn>
<DiffEqn symbol-ref="ERK">
<Expression>(va*FR*(FP/(Kd+FP))*((1-ERK)/(Ka+1-ERK))-vin*(ERK/(Ki+ERK)))</Expression>
</DiffEqn>
<Rule symbol-ref="FP">
<Expression>(1+gamma)*F</Expression>
</Rule>
<Annotation>This system may be disabled if assumed that selective adhesion only occurs after the 32-cell stage. 

If cell differetaiton can occur while selective adhesion is enforced, this system may be reactive. </Annotation>
</System>
<!-- <Disabled>
<ChangeCellType newCellType="ICM" name="Reverse">
<Condition>(G>0.001)*(time<(c2+100))</Condition>
<Annotation>If selective adhesion occurs while cell differiation is still allowed this may be enabaled.

This will revert the cell to ICM in case GATA6 expression surpress the cut off.</Annotation>
</ChangeCellType>
</Disabled>
-->
<CellDivision division-plane="minor">
<Condition>((rand_uni(0,1) < 0.0005)*(time>(c2+400)))*(1-(total == 128))</Condition>
<Annotation>Cell division starts after the Epiblast (Epi) and PrE (PrE) cells are sorted, and stops when the total cell count reaches 128 cells.</Annotation>
</CellDivision>
</CellType>
<CellType class="biological" name="PrE">
<VolumeConstraint target="70" strength="1"/>
<SurfaceConstraint target="0.8" strength="1" mode="aspherity"/>
<Property symbol="G" name="Level of expression of GATA6" value="0.0"/>
<Property symbol="N" name="Level of expression of NANOG" value="0.0"/>
<Property symbol="FR" name="Level of expression of FGFR2 receptors" value="2.8"/>
<Property symbol="ERK" name="Level of activity of FGFR/Erk Signaling pathway" value="0.25"/>
<Property symbol="FP" name="Perceived FGF4" value="0.0"/>
<Property symbol="F" name="Average FGF4 ligand across the cell area" value="0.066"/>
<Property symbol="gamma" value="rand_uni(-0.1,0.1)"/>
<Mapper name="sensing the chemical">
<Input value="FS"/>
<Output symbol-ref="F" mapping="average"/>
<Annotation>Computing the average of the chemical field for FGF4 ligands across the cell.</Annotation>
</Mapper>
<System solver="Dormand-Prince [adaptive, O(5)]">
<DiffEqn symbol-ref="G">
<Expression>((vsg1*((ERK^r)/(Kag1^r+ERK^r))+vsg2*((G^s)/(Kag2^s+G^s)))*((Kig^q)/(Kig^q+N^q))-kdg*G)</Expression>
</DiffEqn>
<DiffEqn symbol-ref="N">
<Expression>((vsn1*(Kin1^u/(Kin1^u+ERK^u))+vsn2*(N^v/(Kan^v+N^v)))*(Kig^q/(Kig^q+N^q))-kdn*N)</Expression>
</DiffEqn>
<DiffEqn symbol-ref="FR">
<Expression>(vsfr1*(Kifr/(Kifr+N))+vsfr2*(G/(Kafr+G))-kdfr*FR)</Expression>
</DiffEqn>
<DiffEqn symbol-ref="ERK">
<Expression>(va*FR*(FP/(Kd+FP))*((1-ERK)/(Ka+1-ERK))-vin*(ERK/(Ki+ERK)))</Expression>
</DiffEqn>
<Rule symbol-ref="FP">
<Expression>(1+gamma)*F</Expression>
</Rule>
<Annotation>This system may be disabled if assumed that selective adhesion only occurs after the 32-cell stage. 

If cell differetaiton can occur while selective adhesion is enforced, this system may be reactive. </Annotation>
</System>
<!-- <Disabled>
<ChangeCellType newCellType="ICM" name="Reverse">
<Condition>(G<0.001)*(time<(c2+100))</Condition>
<Annotation>If selective adhesion occurs while cell differiation is still allowed this may be enabaled.

This will revert the cell to ICM in case GATA6 expression goes under the cut off.</Annotation>
</ChangeCellType>
</Disabled>
-->
<MembraneProperty symbol="contact_PrE" value="0.0">
<Diffusion rate="0"/>
</MembraneProperty>
<PropertyVector symbol="polarity" notation="r,φ,θ" value="1, 0, 0"/>
<NeighborhoodReporter name="Detecting other PrE cells">
<Input scaling="length" value="(cell.type == celltype.PrE.id)"/>
<Output symbol-ref="contact_PrE" mapping="average"/>
</NeighborhoodReporter>
<Mapper name="Polarity based on the contact with other PrE">
<Input value="contact_PrE"/>
<Polarity symbol-ref="polarity"/>
</Mapper>
<VectorFunction symbol="divison_plane" notation="r,φ,θ">
<Expression>1, (polarity.phi-pi), 0.0</Expression>
</VectorFunction>
<NeighborhoodReporter>
<Input scaling="cell" value="((cell.type == celltype.PrE.id) + (cell.type == celltype.Troph.id))"/>
<Output symbol-ref="same" mapping="sum"/>
</NeighborhoodReporter>
<Property symbol="same" value="0.0"/>
<Property symbol="contact_Epi" value="0.0"/>
<NeighborhoodReporter time-step="1.0" name="contact_Epi">
<Input scaling="length" value="cell.type==celltype.Epi.id"/>
<Output symbol-ref="contact_Epi" mapping="sum"/>
</NeighborhoodReporter>
<CellDivision orientation="divison_plane" division-plane="oriented">
<Condition>((1-(same>1))*(time>c2+400))*(contact_Epi>10)</Condition>
<Annotation>Similar to Epiblase (Epi) cells, cell divisions are only ocurring after the sorting of Epi and PrE cells.
For PrE cells division's goal is to keep the layer between the blastocoelic cavity and the Epiblast cluster. So the conditions for cell division are:
1-No contact with another PrE or the trophectoderm, meaning that a gap in the layer was open andmust be filled (Here I used the varibale 'same' to represent this contact)
2-Only PrE cells in contact with the Epi cluster can divide, avoiding PrE cells that are in the cavity to divide
Also because of the cell polarity we can set up the division plane to be towards the missing gap.</Annotation>
</CellDivision>
</CellType>
<CellType class="biological" name="Zygote">
<VolumeConstraint target="vol.target" strength="1"/>
<SurfaceConstraint target="0.8" strength="1" mode="aspherity"/>
<Property symbol="Oct" name="Level of expression of Oct4" value="0.0"/>
<Property symbol="Cdx" name="Level of expression of Cdx2" value="0.0"/>
<System solver="Dormand-Prince [adaptive, O(5)]">
<DiffEqn symbol-ref="Cdx">
<Expression>(k*((b-1.3)+(1.5*S)+a*(Cdx^n/(th^n+Cdx^n)))*(1+i*(th^n/(th^n+Oct^n)))-d*Cdx)*(time-c1<25)</Expression>
</DiffEqn>
<DiffEqn symbol-ref="Oct">
<Expression>(k*(b+a*(Oct^n/(th^n+Oct^n)))*(1+i*(th^n/(th^n+Cdx^n)))-d*Oct)*(time-c1<25)</Expression>
</DiffEqn>
<Annotation>Equations from Cang 2021</Annotation>
</System>
<Property symbol="S" name="Propotion of cell contact with other zygote" value="0"/>
<NeighborhoodReporter name="Contact with other Zygotes">
<Input scaling="length" value="(cell.type == celltype.Zygote.id)"/>
<Output symbol-ref="S" mapping="average"/>
<Annotation>S represnts the propotion of the cell's paramater that is contact with another zygote cell.
This variable is crucial for the cellular differentiation as Cdx2 prodution is amplified with cell-cell contact</Annotation>
</NeighborhoodReporter>
<CellDivision division-plane="minor" daughterID="...">
<Condition>(rand_uni(0,1) < 0.01)*(dc>0)*(time>10)</Condition>
<Triggers>
<Rule symbol-ref="vol.target">
<Expression>vol.target/2</Expression>
</Rule>
<Rule symbol-ref="dc">
<Expression>(dc-1)</Expression>
</Rule>
<Rule symbol-ref="Cdx">
<Expression>Cdx/2</Expression>
</Rule>
<Rule symbol-ref="Oct">
<Expression>Oct/2</Expression>
</Rule>
</Triggers>
<Annotation>When zygote cells divides, it's daughter cells will have half of its volume and expressions of Cdx2 and Oct4.
Also the initial sinlge zygote cel will produce 4 lineages of cells, reaching 16 equal sized cells, so each Zygote has a division counter 'dc' that tells how many more divisions can that cell undergo.
the (time>10) term is just to ensure no cell division happens before the first plot, pure estatic choice. It should not affect drastically the final result. </Annotation>
</CellDivision>
<ConnectivityConstraint/>
<Property symbol="contact_Tro" value="0.0"/>
<NeighborhoodReporter>
<Input scaling="cell" value="(cell.type == celltype.Troph.id)"/>
<Output symbol-ref="contact_Tro" mapping="sum"/>
</NeighborhoodReporter>
<Property symbol="vol.target" value="1600"/>
<Property symbol="dc" name="Division Counter" value="4"/>
<ChangeCellType newCellType="Troph" name="Differentiating to Trophectoderm">
<Condition>(Cdx<2.4)*(time-c1>25)</Condition>
<Annotation>Cells with lower expressions of Cdx2 will become trophectoderm cells.</Annotation>
</ChangeCellType>
<ChangeCellType newCellType="lumen" name="Differentiating to Cavity">
<Condition>(Cdx>2.4)*(celltype.lumen.size <1)*((time-c1)>30)*(contact_Tro == 2)</Condition>
<Annotation>After the differentation into Trophectoderm, one of the inner cells will become the blastcoelic cavity, helping to expand the embryo.
The condtions help to ensure that:
The cavity will be coming from a cell in the inner part of the cluster. That only one cavity cell will be in the system, and that the inner cell that is randomly chosen to be the cavity is not suronded by other inner cells. </Annotation>
</ChangeCellType>
<ChangeCellType newCellType="ICM" name="Differentiating to Inner Cell Mass">
<Condition>(Cdx>2.4)*((time-c1)>32)*(celltype.lumen.size == 1)</Condition>
<Annotation>Once the trophectorderm cells and the cavity have been chosen the rest becomes ICM cells.</Annotation>
</ChangeCellType>
</CellType>
<CellType class="biological" name="Troph">
<VolumeConstraint target="130" strength="1"/>
<SurfaceConstraint target="0.8" strength="1" mode="aspherity"/>
<MembraneProperty symbol="contact_Tro" value="0.0">
<Diffusion rate="0"/>
</MembraneProperty>
<PropertyVector symbol="polarity" notation="r,φ,θ" value="1, 0, 0"/>
<NeighborhoodReporter name="Detecting other Trophectoderm cells">
<Input scaling="length" value="(cell.type == celltype.Troph.id)"/>
<Output symbol-ref="contact_Tro" mapping="average"/>
</NeighborhoodReporter>
<Mapper name="Polarity from Contact with other TE cells.">
<Input value="contact_Tro"/>
<Polarity symbol-ref="polarity"/>
</Mapper>
<VectorFunction symbol="divison_plane" notation="r,φ,θ">
<Expression>1, (polarity.phi-pi), 0.0</Expression>
</VectorFunction>
<NeighborhoodReporter name="Searching for gaps in the TE ring">
<Input scaling="cell" value="(cell.type == celltype.Troph.id)"/>
<Output symbol-ref="same" mapping="sum"/>
</NeighborhoodReporter>
<Property symbol="same" value="0.0"/>
<CellDivision orientation="divison_plane" division-plane="oriented">
<Condition>(1-(same>1))*((time-c1)>40)</Condition>
<Annotation>TE cells divide as the embryo increases in size. When a gap appears in the TE ring, they divide oriented towards the gap to fill it.</Annotation>
</CellDivision>
<ConnectivityConstraint/>
</CellType>
<CellType class="biological" name="lumen">
<VolumeConstraint target="vol.target" strength="0.5"/>
<SurfaceConstraint target="1.8" strength="0.1" mode="aspherity"/>
<Function symbol="vol.target">
<Expression>10+6*(time-c1)</Expression>
</Function>
<Property symbol="time.start" value="0"/>
<Annotation>This cell is to represent the cavity. The high Aspherity with low strength parameter allows this celltype to deform and behave like a liquid.
The volume increases linearly with time from the point of 16-cell stage. </Annotation>
<ConnectivityConstraint/>
</CellType>
</CellTypes>
<CPM>
<MonteCarloSampler stepper="edgelist">
<MCSDuration value="0.5"/>
<Neighborhood>
<Order>2</Order>
</Neighborhood>
<MetropolisKinetics temperature="6"/>
</MonteCarloSampler>
<ShapeSurface scaling="norm">
<Neighborhood>
<Order>6</Order>
</Neighborhood>
</ShapeSurface>
<Interaction default="0.0">
<Contact type1="Epi" type2="Epi" value="-50"/>
<Contact type1="PrE" type2="PrE" value="-20"/>
<Contact type1="Epi" type2="PrE" value="-10"/>
<Contact type1="ICM" type2="Epi" value="-25"/>
<Contact type1="ICM" type2="PrE" value="0"/>
<Contact type1="ICM" type2="ICM" value="-25"/>
<Contact type1="Zygote" type2="Zygote" value="-10"/>
<Contact type1="Zygote" type2="medium" value="15"/>
<Contact type1="Troph" type2="Troph" value="-60"/>
<Contact type1="Troph" type2="medium" value="0"/>
<Contact type1="Zygote" type2="Troph" value="15"/>
<Contact type1="lumen" type2="medium" value="120"/>
<Contact type1="Epi" type2="medium" value="120"/>
<Contact type1="PrE" type2="medium" value="120"/>
<Contact type1="Troph" type2="Epi" value="-20"/>
<Contact type1="Troph" type2="PrE" value="10"/>
<Contact type1="ICM" type2="medium" value="60"/>
<Contact type1="lumen" type2="ICM" value="40"/>
<Contact type1="lumen" type2="Troph" value="20"/>
<Contact type1="lumen" type2="PrE" value="20"/>
<Contact type1="lumen" type2="Epi" value="40"/>
<Contact type1="ICM" type2="Troph" value="-25"/>
</Interaction>
</CPM>
<CellPopulations>
<Population type="Zygote" size="1">
<InitCellObjects mode="distance">
<Arrangement displacements="1, 1, 1" repetitions="1, 1, 1">
<Sphere radius="22.56" center="size.x/2, size.y/2, 0"/>
</Arrangement>
</InitCellObjects>
</Population>
</CellPopulations>
<Analysis>
<ModelGraph format="dot" reduced="false" include-tags="#untagged"/>
<Gnuplotter time-step="100" decorate="false" name="Cell type arrangement">
<Terminal name="png" persist="true"/>
<Plot title="">
<Cells max="6" min="0" value="cell.type">
<ColorMap>
<Color value="0" color="white"/>
<Color value="1" color="red"/>
<Color value="2" color="light-goldenrod"/>
<Color value="3" color="blue"/>
<Color value="4" color="gray"/>
<Color value="5" color="green"/>
<Color value="6" color="light-salmon"/>
</ColorMap>
</Cells>
</Plot>
</Gnuplotter>
<Logger time-step="1.0" name="Cell number time course">
<Input>
<Symbol symbol-ref="ratio_PrE_Epi"/>
</Input>
<Output>
<TextOutput/>
</Output>
<Plots>
<Plot time-step="-1">
<Style style="points"/>
<Terminal terminal="png"/>
<X-axis>
<Symbol symbol-ref="time"/>
</X-axis>
<Y-axis>
<Symbol symbol-ref="total"/>
<Symbol symbol-ref="celltype.Epi.size"/>
<Symbol symbol-ref="celltype.ICM.size"/>
<Symbol symbol-ref="celltype.lumen.size"/>
<Symbol symbol-ref="celltype.PrE.size"/>
<Symbol symbol-ref="celltype.Troph.size"/>
<Symbol symbol-ref="celltype.Zygote.size"/>
</Y-axis>
</Plot>
</Plots>
</Logger>
<Function symbol="ratio_PrE_Epi">
<Expression>celltype.PrE.size / (celltype.PrE.size+celltype.Epi.size)</Expression>
</Function>
</Analysis>
</MorpheusModel>

Downloads
Files associated with this model: