Circle Dance
Persistent Identifier
Use this permanent link to cite or share this Morpheus model:
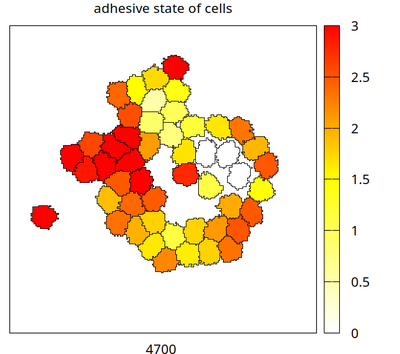
Demonstration of dynamically regulated cell-cell adhesion as a function of changing cell properties
Introduction
This model is an artistic example of cell-state-dependent adhesion.
Description
Cells in isolation produce an adhesive molecule which, if sufficiently high, lets the cells attach to each other. An antagonistic process causes delayed degradation of adhesive molecules when cells are actually in contact. The result is an oscillation with repeated attachment and detachment of cells, reminding of a dance.
The adhesive concentration is used in the HomophilicAdhesion plugin in the //CPM/Interaction/Contact section, i.e. adhesive molecules are required in both neighboring cells to make them adhesive.
Since the HomophilicAdhesion plugin looks for the symbol adhesive_d in all neighboring nodes of a cell, it must also be declared there, including in the medium. To respond with a default value for adhesive_d from medium nodes (or potentially other cell types), we can either declare a default of $0$ in //Global or specifically in //CellType/Medium (done here).
Results
Movie: Visualization of the effect of the adhesion molecules in the cells
When opening the model in the GUI, you may also switch on the so far disabled second Gnuplot with a further state variable (contact_fraction) of the process, which is measured per cell by the NeighborhoodReporter.
Model
CircleDance.xml
XML Preview
<MorpheusModel version="4">
    <Description>
        <Title>Example-CircleDance</Title>
        <Details>Demonstration of dynamically regulated cell-cell adhesion as a function of changing cell properties.

        Date: May 8, 2020

        Author: joern.starruss@tu-dresden.de

        Software: Morpheus (open-source), download from https://morpheus.gitlab.io
        </Details>
    </Description>
    <Global/>
    <Space>
        <SpaceSymbol symbol="l"/>
        <Lattice class="square">
            <Size symbol="size" value="200, 200, 0"/>
            <BoundaryConditions>
                <Condition type="periodic" boundary="x"/>
                <Condition type="periodic" boundary="y"/>
            </BoundaryConditions>
            <Neighborhood>
                <Order>2</Order>
            </Neighborhood>
        </Lattice>
    </Space>
    <Time>
        <StartTime value="0"/>
        <StopTime value="12000"/>
        <RandomSeed value="0"/>
        <TimeSymbol symbol="time"/>
    </Time>
    <CellTypes>
        <CellType name="ct1" class="biological">
            <VolumeConstraint target="200" strength="1"/>
            <Property symbol="contact_length" value="0.0"/>
            <NeighborhoodReporter name="contact_length">
                <Input scaling="length" value="cell.type == celltype.ct1.id"/>
                <Output symbol-ref="contact_length" mapping="sum"/>
            </NeighborhoodReporter>
            <Property symbol="contact_fraction" value="0"/>
            <Equation symbol-ref="contact_fraction">
                <Expression>contact_length / cell.surface</Expression>
            </Equation>
            <Property symbol="adhesive" value="0.0"/>
            <System solver="Dormand-Prince [adaptive, O(5)]">
                <DiffEqn symbol-ref="adhesive">
                    <Expression>0.05*(1-contact_fraction) - 0.01 * adhesive</Expression>
                </DiffEqn>
            </System>
            <DelayProperty symbol="adhesive_d" name="concentration of adhesive molecules in membrane, turnover is delayed due to transport" delay="500" value="0.0"/>
            <Equation symbol-ref="adhesive_d">
                <Expression>adhesive</Expression>
            </Equation>
        </CellType>
        <CellType name="medium" class="medium">
            <Constant symbol="adhesive_d" value="0.0"/>
        </CellType>
    </CellTypes>
    <CPM>
        <Interaction default="0.0">
            <Contact type2="medium" type1="ct1" value="6"/>
            <Contact type2="ct1" type1="ct1" value="16">
                <HomophilicAdhesion strength="-3.0" adhesive="adhesive_d"/>
            </Contact>
        </Interaction>
        <MonteCarloSampler stepper="edgelist">
            <MCSDuration value="1"/>
            <Neighborhood>
                <Order>2</Order>
            </Neighborhood>
            <MetropolisKinetics temperature="2"/>
        </MonteCarloSampler>
        <ShapeSurface scaling="norm">
            <Neighborhood>
                <Order>6</Order>
            </Neighborhood>
        </ShapeSurface>
    </CPM>
    <CellPopulations>
        <Population type="ct1" size="0">
            <InitCircle mode="random" number-of-cells="50">
                <Dimensions center="size.x/2, size.y/2, 0" radius="size.x/3"/>
            </InitCircle>
        </Population>
    </CellPopulations>
    <Analysis>
        <Gnuplotter time-step="100" decorate="true">
            <Terminal name="png"/>
            <Plot title="adhesive state of cells">
                <Cells max="3" flooding="true" min="0" value="adhesive_d">
                    <ColorMap adaptive-range="false">
                        <Color color="red" value="3"/>
                        <Color color="yellow" value="1.5"/>
                        <Color color="white" value="0"/>
                    </ColorMap>
                </Cells>
            </Plot>
            <!--    <Disabled>
        <Plot>
            <Cells flooding="true" value="contact_fraction"/>
        </Plot>
    </Disabled>
-->
        </Gnuplotter>
        <ModelGraph include-tags="#untagged" reduced="false" format="svg"/>
    </Analysis>
</MorpheusModel>

Downloads
Files associated with this model: