Diffusion in Liver Lobule
Persistent Identifier
Use this permanent link to cite or share this Morpheus model:
Diffusion in Liver Lobule
Introduction
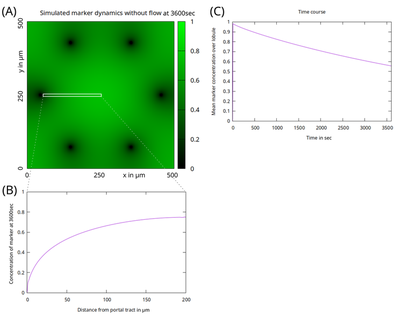
This model considers diffusion of a marker with concentration $c(x,y,t)$ across a liver lobule. The lobule is patterned into a central zone around the central vein (center of simulation domain) and portal zones around (here six) portal triads that here act as sinks ($c = 0$). That pattern and the solution are considered identical along $z$ and only the dynamics in the $xy$ plane is simulated. The simulation runs for $t = 1 \ \mathrm h$ with diffusion constant $D = 3 \ \mathrm{\frac{\mu m^2}{s}}$ and without advection ($v = 0 \ \mathrm{\frac{\mu m}{s}}$). Initially, the marker gets uniformly activated up to $c = 1$. Portal-central axis length is $200 \ \mathrm{µm}$. The simulation demonstrates that diffusion alone without additional bile flow is insufficient to clear the marker from the liver lobule within 1 hour.
Description
The figure shows the concentration pattern $c(x,y,t=1 \ \mathrm h)$ in (A) and a radial concentration profile $c(x,t=1 \ \mathrm{h})$ along the portal-central axis cut in (B) as indicated by the white box in (A). (C) Time course of the mean intensity signal over the entire lobule.
The dynamics is visualized by movies (frames are generated by the model file). The final frames correspond to the above figure.
Model
Diffusion_liver_lobule.xml
XML Preview
<?xml version='1.0' encoding='UTF-8'?>
<MorpheusModel version="4">
<Description>
<Details>Full title: Demonstration that bile diffusion without flow is insufficient to clear from liver lobule within 1hour
Date: October 3, 2020
Authors: michael.kuecken@tu-dresden.de, lutz.brusch@tu-dresden.de
Software: Morpheus (open-source), download from https://morpheus.gitlab.io
Units are: [space]=micrometer, [time]=seconds
</Details>
<Title>Bile Diffusion</Title>
</Description>
<Space>
<Lattice class="square">
<Neighborhood>
<Order>1</Order>
</Neighborhood>
<Size value="500, 500, 0" symbol="size"/>
<NodeLength value="1" symbol="dx"/>
<BoundaryConditions>
<Condition boundary="x" type="periodic"/>
<Condition boundary="-x" type="periodic"/>
<Condition boundary="y" type="periodic"/>
<Condition boundary="-y" type="periodic"/>
</BoundaryConditions>
</Lattice>
<SpaceSymbol symbol="s" name="Position"/>
</Space>
<Time>
<StartTime value="0"/>
<StopTime value="3600" symbol="StopTime_in_seconds"/>
<TimeSymbol symbol="Time" name="Time in seconds"/>
</Time>
<Global>
<Constant value="200" symbol="L" name="CV-PV distance"/>
<Field value="if((s.x-0.25*L+r)^2+(s.y-1.25*L)^2<=r^2, 1, 0) + 
if((s.x-0.75*L+r/2)^2+(s.y-(1.25*L-0.5*sqrt(3)*(L+r)))^2<=r^2, 1, 0) + 
if((s.x-1.75*L-r/2)^2+(s.y-(1.25*L-0.5*sqrt(3)*(L+r)))^2<=r^2, 1, 0) + 
if((s.x-2.25*L-r)^2+(s.y-1.25*L)^2<=r^2, 1, 0) + 
if((s.x-1.75*L-r/2)^2+(s.y-(1.25*L+0.5*sqrt(3)*(L+r)))^2<=r^2, 1, 0) + 
if((s.x-0.75*L+r/2)^2+(s.y-(1.25*L+0.5*sqrt(3)*(L+r)))^2<=r^2, 1, 0)" symbol="loc_sink" name="Locations of intralobular bile ducts as sinks for marker"/>
<Constant value="0.1" symbol="k_source" name="Initial marker activation rate"/>
<Constant value="10" symbol="time_source" name="Duration of initial marker activation/release into BC"/>
<Constant value="5.0" symbol="r" name="Radius of IBD in micrometer determines size of sinks"/>
<Field value="0.0" symbol="c" name="Concentration of marker">
<Diffusion rate="3"/>
</Field>
<System time-step="1" solver="Runge-Kutta [fixed, O(4)]">
<DiffEqn name="Marker reaction-diffusion model" symbol-ref="c">
<Expression>k_source*(1-loc_sink)*(Time<time_source)</Expression>
</DiffEqn>
</System>
<Variable value="0.0" symbol="c_mean" name="Mean marker concentration over lobule"/>
<Mapper time-step="60" name="mean of c">
<Input value="c"/>
<Output mapping="average" symbol-ref="c_mean"/>
</Mapper>
<Event trigger="when true" time-step="1" name="Complete clearance in IBD">
<Condition>loc_sink</Condition>
<Rule symbol-ref="c">
<Expression>0.0</Expression>
</Rule>
</Event>
<Field value="s.x-0.25*L" symbol="x" name="Distance from portal tract"/>
</Global>
<Analysis>
<Gnuplotter log-commands="false" time-step="60" decorate="true">
<Plot title="Simulated marker dynamics without flow">
<Field symbol-ref="c" max="1" min="0">
<ColorMap>
<Color value="1" color="green"/>
<Color value="0" color="black"/>
</ColorMap>
</Field>
</Plot>
<Terminal name="png"/>
</Gnuplotter>
<DependencyGraph format="svg" reduced="false" include-tags="#untagged"/>
<Logger time-step="1" name="Time course of marker statistics">
<Input>
<Symbol symbol-ref="c_mean"/>
</Input>
<Output>
<TextOutput/>
</Output>
<Plots>
<Plot time-step="60" title="Time course">
<Style decorate="true" line-width="1.0" style="lines" point-size="1.0"/>
<Terminal terminal="png"/>
<X-axis maximum="3600" minimum="0">
<Symbol symbol-ref="Time"/>
</X-axis>
<Y-axis>
<Symbol symbol-ref="c_mean"/>
</Y-axis>
</Plot>
</Plots>
</Logger>
<Logger time-step="10" name="Spatial profile of marker concentration">
<Restriction condition="(s.x>=0.25*L)*(s.x<=1.25*L)*(s.y==1.25*L)"/>
<Input>
<Symbol symbol-ref="c"/>
<Symbol symbol-ref="x"/>
</Input>
<Output>
<TextOutput/>
</Output>
<Plots>
<Plot time-step="60" title="Spatial profile">
<Style decorate="true" line-width="1.0" style="lines" point-size="1.0"/>
<Terminal terminal="png"/>
<X-axis>
<Symbol symbol-ref="x"/>
</X-axis>
<Y-axis maximum="1" minimum="0">
<Symbol symbol-ref="c"/>
</Y-axis>
<Range>
<Time mode="current"/>
</Range>
</Plot>
<Plot time-step="60" title="Space-time plot of marker concentration dynamics">
<Style decorate="true" style="points"/>
<Terminal terminal="png"/>
<X-axis maximum="3600" minimum="0">
<Symbol symbol-ref="Time"/>
</X-axis>
<Y-axis maximum="200" minimum="0">
<Symbol symbol-ref="x"/>
</Y-axis>
<Color-bar palette="rainbow" maximum="1" minimum="0">
<Symbol symbol-ref="c"/>
</Color-bar>
</Plot>
</Plots>
</Logger>
</Analysis>
</MorpheusModel>
Downloads
Files associated with this model: