Lateral Line Primordium in 1D
Persistent Identifier
Use this permanent link to cite or share this Morpheus model:
Spatio-temporal model of self-organisation inside the zebrafish posterior lateral line primordium
Introduction
The zebrafish posterior lateral line primordium is the precursor of the neuromasts, which form sensory organs responding to fluid flow. At approximately 22-48 hours post-fertilization, this moving cell cluster consists of approximately 100 cells dynamically subdivided into leading versus trailing phenotypes in a self-organizing process. This self-organizing process relies on feedback loops between ligand and receptor expression and was modeled and analyzed as part of a larger 3D multicellular model in the publication Knutsdottir et al..
Description
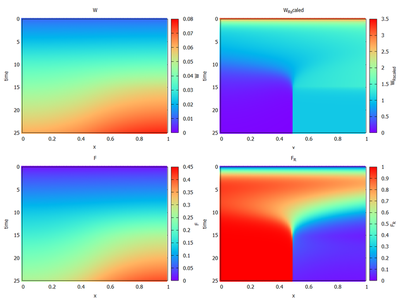
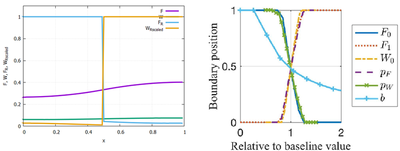
The model shown here implements the published partial differential equations Eq. 6 from Knutsdottir et al., as well as Eq. 10a,b and Eq. 15a,b from supplementary materials S1. Parameter values are taken as published in supplementary materials S4 and S6. This Morpheus model reproduces the results published in Figure 5 and Figure 6 (shown below).
Please note, that the plots for $W_\mathrm{B}$ and $F_\mathrm{B}$ have been omitted in the Morpheus figure, since these variables serve no further purpose and were therefore left out in the model. However, they could be easily added by adding a Morpheus function. Furthermore, note that the right figure in Figure 6 was created with an external Python script. Morpheus generated the necessary data with the ParameterSweep module in the GUI. The separate Python code for analysis of the data resulted in the same graph, but is not included here.
 ([Figure 5](https://doi.org/10.1371/journal.pcbi.1005451.g005)). [*CC0 1.0*](https://creativecommons.org/publicdomain/zero/1.0/)](/media/model/m7912/pcbi.1005451.g005_hue95288d3a77d986dc75b59e59fbfdb8a_422447_e34bea594027d187604162e7fab0f9d6.png)
 ([Figure 6](https://doi.org/10.1371/journal.pcbi.1005451.g006)). [*CC0 1.0*](https://creativecommons.org/publicdomain/zero/1.0/)](/media/model/m7912/pcbi.1005451.g006_hu9db64b77499ab88152ff056027879a02_197315_a7b672b0d6a7e06abdc72f8017687859.png)
Reference
This model is described in the peer-reviewed publication:
H. Knutsdottir, C. Zmurchok, D. Bhaskar, E. Palsson, D. D. Nogare, A. B. Chitnis, L. Edelstein-Keshet: Polarization and migration in the zebrafish posterior lateral line system. PLOS Comput. Biol. 13 (4), 1-26, 2017.
Model
LateralLinePrimordium_1DCells_Polarization.xml
XML Preview
<?xml version='1.0' encoding='UTF-8'?>
<MorpheusModel version="4">
<Description>
<Details>Full title: Spatio-temporal model of selforganisation and collective migration of the lateral line primordium.
Date: 18.3.2021
Authors: Hildur Knutsdottir, Cole Zmurchok, Dhananjay Bhaskar, Eirikur Palsson, Damian Dalle Nogare, Ajay B. Chitnis and Leah Edelstein-Keshet
Curators: Ferras El-Hendi (ferras_mahmoud.el-hendi@tu-dresden.de), Ulrike Rückert (ulrike.rueckert@tu-dresden.de), Alisa Mironenko, Saravanakumar Gopalakrishnan, Lutz Brusch (lutz.brusch@tu-dresden.de)
Software: Morpheus (open-source), download from https://morpheus.gitlab.io
Reference: This model is described in the peer-reviewed publication
[1] "Polarization and migration in the zebrafish posterior lateral line system" by Hildur Knutsdottir, Cole Zmurchok, Dhananjay Bhaskar, Eirikur Palsson, Damian Dalle Nogare, Ajay B. Chitnis and Leah Edelstein-Keshet.
PLOS Computational Biology 13(4), 1-26, 2017. https://doi.org/10.1371/journal.pcbi.1005451
</Details>
<Title>LateralLinePrimordium_1DCells_Polarization</Title>
</Description>
<Space>
<Lattice class="linear">
<Neighborhood>
<Order>1</Order>
</Neighborhood>
<Size value="100, 0.0, 0.0" symbol="size"/>
<BoundaryConditions>
<Condition type="noflux" boundary="x"/>
<Condition type="noflux" boundary="-x"/>
</BoundaryConditions>
<NodeLength value="1"/>
</Lattice>
<SpaceSymbol symbol="space"/>
</Space>
<Time>
<StartTime value="0"/>
<StopTime value="25"/>
<TimeSymbol name="Time" symbol="time"/>
</Time>
<Analysis>
<Logger name="Concentration Ligands and Receptor Levels" time-step="0.01">
<Input force-node-granularity="true">
<!-- <Disabled>
<Symbol symbol-ref="F"/>
</Disabled>
-->
<!-- <Disabled>
<Symbol symbol-ref="W"/>
</Disabled>
-->
<!-- <Disabled>
<Symbol symbol-ref="F_R"/>
</Disabled>
-->
<!-- <Disabled>
<Symbol symbol-ref="W_R"/>
</Disabled>
-->
<!-- <Disabled>
<Symbol symbol-ref="W_R_scaled"/>
</Disabled>
-->
</Input>
<Output>
<TextOutput/>
</Output>
<Plots>
<Plot time-step="-1" title="F">
<Style style="points" decorate="true"/>
<Terminal terminal="png"/>
<X-axis minimum="0" maximum="1">
<Symbol symbol-ref="x"/>
</X-axis>
<Y-axis minimum="25" maximum="0">
<Symbol symbol-ref="time"/>
</Y-axis>
<Color-bar minimum="0.0" palette="rainbow" maximum="0.4">
<Symbol symbol-ref="F"/>
</Color-bar>
</Plot>
<Plot time-step="-1" title="W">
<Style style="points" decorate="true"/>
<Terminal terminal="png"/>
<X-axis minimum="0" maximum="1">
<Symbol symbol-ref="x"/>
</X-axis>
<Y-axis minimum="25" maximum="0">
<Symbol symbol-ref="time"/>
</Y-axis>
<Color-bar minimum="0.0" palette="rainbow" maximum="0.08">
<Symbol symbol-ref="W"/>
</Color-bar>
</Plot>
<Plot time-step="-1" title="F_R">
<Style style="points" decorate="true"/>
<Terminal terminal="png"/>
<X-axis minimum="0" maximum="1">
<Symbol symbol-ref="x"/>
</X-axis>
<Y-axis minimum="25" maximum="0">
<Symbol symbol-ref="time"/>
</Y-axis>
<Color-bar minimum="0.0" palette="rainbow" maximum="1.0">
<Symbol symbol-ref="F_R"/>
</Color-bar>
</Plot>
<Plot time-step="-1" title="W_R_scaled">
<Style style="points" decorate="true"/>
<Terminal terminal="png"/>
<X-axis minimum="0" maximum="1">
<Symbol symbol-ref="x"/>
</X-axis>
<Y-axis minimum="25" maximum="0">
<Symbol symbol-ref="time"/>
</Y-axis>
<Color-bar minimum="0.0" palette="rainbow" maximum="1.0">
<Symbol symbol-ref="W_R_scaled"/>
</Color-bar>
</Plot>
<Plot time-step="1">
<Style line-width="4.0" style="lines" decorate="true" grid="true"/>
<Terminal terminal="png"/>
<X-axis minimum="0" maximum="1">
<Symbol symbol-ref="x"/>
</X-axis>
<Y-axis minimum="0.0" maximum="1.1">
<Symbol symbol-ref="F"/>
<Symbol symbol-ref="W"/>
<Symbol symbol-ref="F_R"/>
<Symbol symbol-ref="W_R_scaled"/>
</Y-axis>
<Range>
<Time mode="current"/>
</Range>
</Plot>
</Plots>
</Logger>
<!-- <Disabled>
<Logger time-step="-1.0">
<Input>
<Symbol symbol-ref="W_1x"/>
</Input>
<Output>
<TextOutput/>
</Output>
<Plots>
<Plot time-step="-1" title="W_1x">
<Style style="points"/>
<Terminal terminal="png"/>
<X-axis>
<Symbol symbol-ref="x"/>
</X-axis>
<Y-axis>
<Symbol symbol-ref="W_1x"/>
</Y-axis>
</Plot>
</Plots>
</Logger>
</Disabled>
-->
<ModelGraph reduced="false" format="svg" include-tags="#untagged,CXCL12a,FGF,FGFR,PLLP,Simulation,Wnt,WntR,Wntr,length"/>
</Analysis>
<Global>
<System name="Unscaled Global System Eq. (6) and (15)" solver="Runge-Kutta [fixed, O(4)]" time-step="delta_t">
<DiffEqn tags="FGF, FGFR, Wnt, WntR" name="Equation (15a)" symbol-ref="F">
<Expression>- (delta_F*F) - (k_Fon*F*F_R*(1/(1+(F/K_F)))) + (p_F*W_R*(W/(K_W+W)))</Expression>
</DiffEqn>
<DiffEqn tags="FGF, FGFR, Wnt, WntR" name="Equation (15b)" symbol-ref="W">
<Expression>- (delta_W*W) - (k_Won*W*W_R*(1/(1+(W/K_W)))) + (p_W*W_R*(W/(K_W+W)))</Expression>
</DiffEqn>
<DiffEqn tags="CXCL12a" name="Equation (6)" symbol-ref="C">
<Expression>alpha - (delta_C*C) - (k_CF*C*Omega_F) - (k_CW*C*Omega_W)</Expression>
</DiffEqn>
</System>
<Constant tags="Simulation" value="0.01" name="simulation time-step" symbol="delta_t"/>
<Field tags="FGF" value="0.005" name="FGF concentration" symbol="F">
<Diffusion rate="600"/>
</Field>
<Field tags="Wnt" value="0.01" name="Wnt ligand concentration" symbol="W">
<Diffusion rate="600"/>
</Field>
<Field tags="CXCL12a" value="0.45" name="CXCL12a chemokine concentration" symbol="C">
<Diffusion rate="20"/>
</Field>
<Constant tags="CXCL12a" value="0.2" name="constant production of CXCL12a" symbol="alpha"/>
<Constant tags="FGF" value="0.002" name="decay rate of FGF ligand" symbol="delta_F"/>
<Constant tags="Wnt" value="0.03" name="decay rate of Wnt ligand" symbol="delta_W"/>
<Constant tags="CXCL12a" value="0.2" name="external decay rate of CXCL12a" symbol="delta_C"/>
<Constant tags="FGF, FGFR" value="0.1" name="rate of binding to FGF receptors" symbol="k_Fon"/>
<Constant tags="Wnt, WntR" value="0.005" name="rate of binding to Wnt receptors" symbol="k_Won"/>
<Constant tags="CXCL12a" value="1.0" name="rate of breakdown of CXCL12a by cells expressing FGFR / undetermined" symbol="k_CF"/>
<Constant tags="CXCL12a, WntR" value="0.05" name="rate of breakdown of CXCL12a by cells expressing WntR" symbol="k_CW"/>
<Constant tags="FGF" value="0.1" name="FGF IC50 level" symbol="F_0"/>
<Constant tags="Wnt" value="0.001" name="Wnt IC50 level" symbol="W_0"/>
<Constant tags="FGF, FGFR" value="1.0" name="steady state FGF receptor concentration" symbol="F_1"/>
<Constant tags="Wnt, WntR" value="0.03" name="steady state WntR receptor concentration at left End" symbol="W_1"/>
<Function tags="PLLP" name="gradient steady-state parameter W_1" symbol="W_1x">
<Expression>b * (space.x / length_x) + W_1</Expression>
</Function>
<Constant tags="FGFR" value="24.0" name="FGF receptor endocytosis rate" symbol="p_F"/>
<Constant tags="Wnt" value="4.0" name="Wnt secretion rate for W_1 gradient" symbol="p_W"/>
<Constant tags="FGFR" value="0.0" name="level of cell_surface FGF receptors" symbol="F_R"/>
<Constant tags="FGFR" value="0.0" name="normalized level of cell-surface FGF receptors relative to cell surface" symbol="F_R_normalized"/>
<Constant tags="Wntr" value="0.0" name="level of cell_surface Wnt receptors" symbol="W_R"/>
<Constant tags="WntR" value="0.0" name="normalized level of cell-surface Wnt receptors relative to cell surface" symbol="W_R_normalized"/>
<Constant tags="FGFR" value="0.0" name="local fraction of cells expressing FGF Receptors / undetermined" symbol="Omega_F"/>
<Constant tags="WntR" value="0.0" name="local fraction of cells expressing Wnt Receptors" symbol="Omega_W"/>
<Constant tags="FGFR" value="1" name="FGF receptor endocytosis rate" symbol="r_F"/>
<Constant tags="WntR" value="1" name="Wnt receptor endocytosis rate" symbol="r_W"/>
<Constant tags="FGF" value="1.0" name="FGF Michaelis-Menten Konstante" symbol="K_F"/>
<Constant tags="Wnt" value="1.0" name="Wnt Michaelis-Menten Konstante" symbol="K_W"/>
<Variable tags="WntR" value="0.03000027178" name="Store maximum value of WntR concentration" symbol="W_R_max"/>
<Constant tags="WntR" value="0.0" name="WntR concentration relative to maximum of observed WntR concentration" symbol="W_R_scaled">
<Annotation>Level of Wnt Receptors is scaled relative to its maximum value, to be able to visualize level of Wnt Receptors in same diagram and on same scale as the other concentration levels (F, W, F_R)
Cp. [1], Fig. 6 (left)</Annotation>
</Constant>
<Function tags="Wnt" name="Slope parameter for W_1 gradient" symbol="b">
<Expression>if(time<t_cutoff, 0.01, 0)</Expression>
<Annotation>Includes time-dependent switch because original paper suggests, that the W_1 field is only graded initially.</Annotation>
</Function>
<Constant tags="WntR" value="15" name="cutoff point where initial W_1 gradient is switched off" symbol="t_cutoff"/>
<Constant tags="length" value="0.0" name="spatial coordinate relative to length of PLLP" symbol="x"/>
<Constant tags="length" value="0.0" symbol="min_x"/>
<Constant tags="length" value="size.x" symbol="max_x"/>
<Constant tags="length" value="max_x-min_x" name="Length of PLLP" symbol="length_x"/>
</Global>
<CellTypes>
<CellType name="cell" class="biological">
<System solver="Runge-Kutta [fixed, O(4)]" time-step="delta_t">
<DiffEqn tags="FGFR, WntR" name="Equation (10a)" symbol-ref="F_R">
<Expression>r_F*( (F_1 / (1 + ((W_R * W_local) / ((1 + W_local) * W_0) )^5 ) ) - F_R )</Expression>
</DiffEqn>
<DiffEqn tags="FGFR, WntR" name="Equation (10b)" symbol-ref="W_R">
<Expression>r_W*( (W_1x / (1 + ((F_R * F_local) / ((1 + F_local) * F_0) )^5 ) ) - W_R )</Expression>
</DiffEqn>
<Rule tags="FGFR" symbol-ref="Omega_F">
<Expression>F_R > 0.9 * F_1</Expression>
</Rule>
<Rule tags="WntR" symbol-ref="Omega_W">
<Expression>W_R > 0.9 * W_1</Expression>
</Rule>
<Rule tags="length" symbol-ref="x">
<Expression>(cell.center.x-min_x)/length_x</Expression>
</Rule>
<Rule tags="Wnt" symbol-ref="W_1x">
<Expression>b*x+W_1</Expression>
</Rule>
</System>
<Property tags="FGFR" value="0.01" name="level of cell-surface FGF receptors" symbol="F_R"/>
<Property tags="FGF" value="0.005" name="local FGF concentration" symbol="F_local"/>
<Property tags="FGFR" value="0.0" name="normalized level of cell-surface FGF receptors relative to cell surface" symbol="F_R_normalized"/>
<Property tags="WntR" value="0.1" name="level of cell-surface Wnt receptors" symbol="W_R"/>
<Property tags="Wnt" value="0.01" name="local Wnt concentration" symbol="W_local"/>
<Property tags="WntR" value="0.0" name="normalized level of cell-surface Wnt receptors relative to cell surface" symbol="W_R_normalized"/>
<Function tags="WntR" name="WntR concentration relative to maximum of observed WntR concentration" symbol="W_R_scaled">
<Expression>W_R / W_R_max</Expression>
</Function>
<Mapper tags="FGF" name="Global FGF concentration to local cell">
<Input value="F"/>
<Output symbol-ref="F_local" mapping="average"/>
</Mapper>
<Mapper tags="Wnt" name="Global Wnt concentration to local cell">
<Input value="W"/>
<Output symbol-ref="W_local" mapping="average"/>
</Mapper>
<Equation tags="FGFR" name="Equation to calculate F_R_normalized every time-step" symbol-ref="F_R_normalized">
<Expression>F_R/cell.surface</Expression>
</Equation>
<Equation tags="WntR" name="Equation to calculate W_R_normalized every time-step" symbol-ref="W_R_normalized">
<Expression>W_R/cell.surface</Expression>
</Equation>
<Property tags="FGFR" value="0.0" name="local fraction of cells expressing FGF Receptors / undetermined" symbol="Omega_F"/>
<Property tags="WntR" value="0.0" name="local fraction of cells expressing Wnt Receptors" symbol="Omega_W"/>
<Property tags="length" value="0.0" name="spatial coordinate scaled to length" symbol="x"/>
<Property tags="Wnt" value="0.0" name="gradient steady-state parameter W_1" symbol="W_1x"/>
</CellType>
</CellTypes>
<CellPopulations>
<Population type="cell" size="1">
<InitCellObjects mode="distance">
<Arrangement displacements="size.x/100, 0, 0" repetitions="size.x, 0, 0">
<Box origin="0, 0.0, 0.0" size="size.x/100, 0.0, 0.0"/>
</Arrangement>
</InitCellObjects>
</Population>
</CellPopulations>
</MorpheusModel>
Downloads
Files associated with this model: