Mixed-mode Oscillations in a Rac/Rho/Paxillin Subsystem
Persistent Identifier
Use this permanent link to cite or share this Morpheus model:
Different cell migration patterns may result from different dynamic states like wave pinning (WP), mixed-mode oscillations (MMO) and relaxation oscillations (RO) of the Rho-Rac-paxillin circuit on the cell membrane.
Introduction
Different patterns of cell migration including directional, exploratory and stationary have been observed for Chinese hamster Ovary (CHO-K1) cells and are related to a mechanistic model of cell polarity (Plazen et al., 2023). This model of 4 coupled PDEs for the Rho-Rac-paxillin circuit on the cell membrane generates different cell migration patterns that correspond to different dynamic states of the PDEs like wave pinning (WP), mixed-mode oscillations (MMO) and relaxation oscillations (RO).
Description
The original model was developed in the Morpheus 2.2 series and can be downloaded as model_2.2.xml.
In addition, it has here been updated (added Plots for R, B, kb and swapped order of function declarations for P, Iks inside CellType/System to ease initialization) and can be downloaded as model.xml to run in the latest version of Morpheus (currently the 2.3 series).
The key parameter LK can be changed in CellType/System.
Runtime in the paper is typically $8\times10^4$ time steps while the model here stops at $5\times10^3$ time steps to give a quick impression.
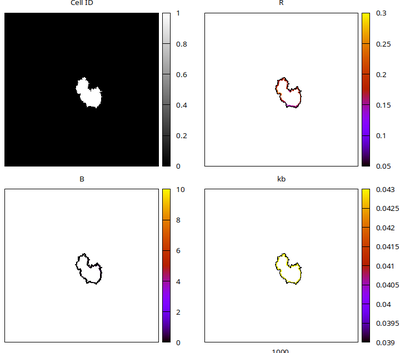
Results
A typical simulation result is shown below.
Reference
This model is the original used in the publication, up to technical updates:
L. Plazen, J. Al Rahbani, C. M. Brown, A. Khadra: Polarity and mixed-mode oscillations may underlie different patterns of cellular migration. Scientific Reports 13: 4223, 2023.
Model
model.xml
XML Preview
<MorpheusModel version="4">
<Description>
<Title>Plazen2023</Title>
<Details>Full title: Mixed-mode oscillations in a Rac/Rho/Paxillin subsystem
Date: 06.01.2023
Authors: L. Plazen
ModelID: https://identifiers.org/morpheus/M7682
Software: Morpheus (open-source), download from https://morpheus.gitlab.io
Reference: This model is described in Polarity and mixed-mode oscillations may underlie different patterns of cellular migration. (2023) L. Plazen, J. Al Rahbani, C.M. Brown, A. Khadra. Scientific Reports 13, 4223.
https://doi.org/10.1038/s41598-023-31042-8
</Details>
</Description>
<Global>
<Field symbol="U" value="0"/>
<Function symbol="x">
<Expression>discr*lattice.x</Expression>
</Function>
<Function symbol="y">
<Expression>discr*lattice.y</Expression>
</Function>
</Global>
<Space>
<Lattice class="square">
<Size symbol="lattice" value="250, 250, 0"/>
<NodeLength symbol="discr" value="0.1"/>
<BoundaryConditions>
<Condition type="periodic" boundary="x"/>
<Condition type="periodic" boundary="y"/>
</BoundaryConditions>
<Neighborhood>
<Order>1</Order>
</Neighborhood>
</Lattice>
<SpaceSymbol symbol="space"/>
<MembraneLattice>
<Resolution symbol="memsize" value="200"/>
<SpaceSymbol symbol="m"/>
</MembraneLattice>
</Space>
<Time>
<StartTime value="0"/>
<StopTime value="5000"/>
<SaveInterval value="0"/>
<TimeSymbol symbol="time"/>
<RandomSeed value="19"/>
</Time>
<CellTypes>
<CellType name="cells" class="biological">
<Protrusion strength="2" field="U" maximum="1000"/>
<VolumeConstraint target="1200" strength="0.0004"/>
<SurfaceConstraint target="200" strength="0.002" mode="surface"/>
<ConnectivityConstraint/>
<MembraneProperty symbol="R" name="R" value="if((m.phi<=0.1 and m.phi>0) or (m.phi >0.3 and m.phi<0.4) or (m.phi >0.5 and m.phi<0.65) or (m.phi >0.7 and m.phi<0.72) or (m.phi >2 and m.phi<2.4) or (m.phi >3.5 and m.phi<3.7) or (m.phi >4 and m.phi<4.2) or (m.phi >5.1 and m.phi<5.7) or (m.phi >6 and m.phi<6.2) or (m.phi >7 and m.phi<7.2) , 0.3, 0.05)">
<Diffusion rate="0.0025"/>
</MembraneProperty>
<MembraneProperty symbol="RI" name="RI" value="if((m.phi<=0.1 and m.phi>0) or (m.phi >0.3 and m.phi<0.4) or (m.phi >0.5 and m.phi<0.65) or (m.phi >0.7 and m.phi<0.72) or (m.phi >2 and m.phi<2.4) or (m.phi >3.5 and m.phi<3.7) or (m.phi >4 and m.phi<4.2) or (m.phi >5.1 and m.phi<5.7) or (m.phi >6 and m.phi<6.2) or (m.phi >7 and m.phi<7.2), 0.4669, 0.8385)">
<Diffusion rate="0.43"/>
</MembraneProperty>
<MembraneProperty symbol="B" name="B" value="if((m.phi<=0.1 and m.phi>0) or (m.phi >0.3 and m.phi<0.4) or (m.phi >0.5 and m.phi<0.65) or (m.phi >0.7 and m.phi<0.72) or (m.phi >2 and m.phi<2.4) or (m.phi >3.5 and m.phi<3.7) or (m.phi >4 and m.phi<4.2) or (m.phi >5.1 and m.phi<5.7) or (m.phi >6 and m.phi<6.2) or (m.phi >7 and m.phi<7.2) , 0.5, 2)">
<Diffusion rate="0"/>
</MembraneProperty>
<MembraneProperty symbol="kb" name="kb" value="0.05">
<Diffusion rate="0"/>
</MembraneProperty>
<System time-step="0.1" name="4DPDE" solver="Euler-Maruyama [stochastic, O(1)]">
<Constant symbol="a" value="0.6281"/>
<Constant symbol="d" value="2.8773"/>
<Constant symbol="c" value="11.5"/>
<Constant symbol="Irho" name="Rho activation rate" value="0.016"/>
<Constant symbol="IR" name="Rac activation rate" value="0.0035"/>
<Constant symbol="Ik" name="Paxillin basal activation rate" value="0.009"/>
<Constant symbol="LR" name="Half max value in the Hill function of Rac" value="0.34"/>
<Constant symbol="Lrho" name="Half max value in the Hill function of Rho" value="0.34"/>
<Constant symbol="LK" name="Half max value in the Hill function of paxillin" value="5.77"/>
<Constant symbol="gamma" value="0.3"/>
<Constant symbol="epsilon" value="0.01"/>
<Constant symbol="epsilon_kb" value="0.00001"/>
<Constant symbol="gammaR" name="Parameter for the nullcline" value="8.69565"/>
<Constant symbol="alphaR" value="15"/>
<Constant symbol="alphaP" name="Linearization of Paxillin" value="2.7"/>
<Constant symbol="n" name="Non linearity level, Hill coefficient" value="4"/>
<Constant symbol="delta_P" name="Paxillin inactivation rate for Paxillin" value="0.00041"/>
<Constant symbol="delta_rho" name="Rho inactivation rate" value="0.016"/>
<Constant symbol="delta_rac" name="Rac inactivation rate" value="0.025"/>
<DiffEqn symbol-ref="R" name="PDE for active Rac">
<Expression>(IR+Iks())* (Lrho^n/ ( Lrho^n + Rho()^n) )*(RI) - delta_rac*R </Expression>
</DiffEqn>
<DiffEqn symbol-ref="RI" name="PDE for inactive Rac">
<Expression>-(IR+Iks())* (Lrho^n/ ( Lrho^n + Rho()^n) )*(RI) + delta_rac*R </Expression>
</DiffEqn>
<DiffEqn symbol-ref="B" name="PDE for B">
<Expression>dBdt</Expression>
</DiffEqn>
<DiffEqn symbol-ref="kb" name="PDE for kb">
<Expression>epsilon_kb*(0.15-R)</Expression>
</DiffEqn>
<Function symbol="dBdt" name="Derivative for B">
<Expression>epsilon*(1-kb*(B-10) -gammaR*R + 0.00001/(B+0.00001))</Expression>
</Function>
<Function symbol="K" name="Expression of K">
<Expression>alphaR*R /(1 + alphaR * R + (a*d)/(1 + d + 3/(1+1*R)))</Expression>
</Function>
<Function symbol="Rho" name="Expression of Rho in the QSSA">
<Expression>( Irho*LR^n)/( Irho*LR^n + delta_rho*( LR^n + (R + gamma*K())^n ) )</Expression>
</Function>
<Function symbol="P" name="Active Paxillin">
<Expression>B*(K()^n/(LK^n+K()^n))/( alphaP*B*(K()^n/(LK^n+K()^n)) + delta_P) </Expression>
</Function>
<Function symbol="Iks" name="Paxillin activation rate">
<Expression>Ik*(1 - 1/(1 + d + a*d*c*P + 0.5 ))</Expression>
</Function>
</System>
<Mapper>
<Input value="R-0.15"/>
<Output symbol-ref="U"/>
</Mapper>
</CellType>
</CellTypes>
<CPM>
<MonteCarloSampler stepper="edgelist">
<MCSDuration value="0.5"/>
<Neighborhood>
<Order>3</Order>
</Neighborhood>
<MetropolisKinetics yield="0.1" temperature="0.12"/>
</MonteCarloSampler>
<ShapeSurface scaling="norm">
<Neighborhood>
<Order>3</Order>
</Neighborhood>
</ShapeSurface>
<Interaction/>
</CPM>
<CellPopulations>
<Population type="cells" size="0">
<InitCellObjects mode="distance">
<Arrangement repetitions="1,1,1" displacements="0,0,0">
<Sphere center="lattice.x/2,lattice.x/2,0" radius="20"/>
</Arrangement>
</InitCellObjects>
</Population>
</CellPopulations>
<Analysis>
<Gnuplotter time-step="1000">
<Terminal name="png" size="720, 720, 0"/>
<Plot>
<Field symbol-ref="cell.id">
<ColorMap>
<Color color="white" value="1"/>
<Color color="black" value="0"/>
</ColorMap>
</Field>
</Plot>
<Plot>
<Cells max="0.3" min="0.05" value="R"/>
</Plot>
<Plot>
<Cells max="10" min="0" value="B"/>
</Plot>
<Plot>
<Cells max="0.043" min="0.039" value="kb"/>
</Plot>
</Gnuplotter>
<CellTracker time-step="5" format="ISBI 2012 (XML)"/>
<DisplacementTracker celltype="cells" time-step="1"/>
<ModelGraph include-tags="#untagged" format="dot" reduced="false"/>
</Analysis>
</MorpheusModel>

Downloads
Files associated with this model: