Collective Motion of MDA-MB-231 Breast Cancer Cells
Persistent Identifier
Use this permanent link to cite or share this Morpheus model:
Introduction
Collective motion of human breast cancer cells of the cell line MDA-MB-231 was studied by Lee et al. for individual crawling cells, cell doublets, cell quadruplets and for confluent populations on a two-dimensional substrate. Lee et al. found enhanced diffusivity as well as periodic rotation of cell-doublets and cell-quadruplets with mixing events.
Using a simple Cellular Potts Model in Morpheus, they showed that active self-propulsion and cell-cell adhesion together are sufficient for reproducing the experimentally observed phenomena of collective motion. Interestingly, these cells diffuse more persistently within a densely packed population than when they are free to crawl around individually or in small clusters.
Model Description
Lee et al. use a deliberately simple individual-based model with persistent cell motility (parameterized by the strength $S$ of PersistentMotion) and cell-cell adhesion (parameterized by the adhesion energy $E$ compared to 0 for medium interfaces) to capture and test two basic mechanisms of MDA-MB-231 breast cancer cells.
Individual cell shapes are spatially resolved on a two-dimensional lattice to allow studying dynamic rearrangements of cell order within rotating quadruplets.
Mechanics and motility of the spatially resolved cells is govered by the Cellular Potts Model (CPM) This Morpheus model was developed with an older version of Morpheus and shared by Lee et al. together with the publication at GitHub. We here tested the model on the latest Morpheus version and added many observables.
To quantify cell order, the dynamically changing center of mass vector com is calculated for each cell arrangement.
Then for each individual cell, the distance vector from com to that cell’s centroid is calculated and its length output as $d$ ($\mu$m) and its angle as $\theta$ (rad).
The time unit is minute and the space unit is micrometer.
The initial cell arrangement can be readily toggled in CellPopulations.
The parameter values are set to $S=2.8, E=-65$ as used in Figs. 4-6 in Lee et al..
Results
Published simulation results for cell quadruplet
 ([Fig. 6a,b](https://doi.org/10.1371/journal.pcbi.1009447.g006)) [*CC BY 4.0*](https://creativecommons.org/licenses/by/4.0/)](/media/model/m7678/Fig6ab_published_huf5751c6fa74d2a16334dccc226c1da92_677449_4a35429f73c696b3f911b70a661d3d30.png)
Reproduced results
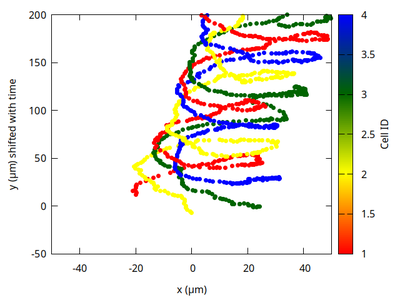
The trajectories of all cells are plotted on the x-y plane with the y-coordinate shifted by time such that the rotations of all cells do no longer overlap and become better visible, also mimicking the three-dimensional plot in Fig. 6a. The color bar appears continuous but should be discrete with just four integer cell IDs.
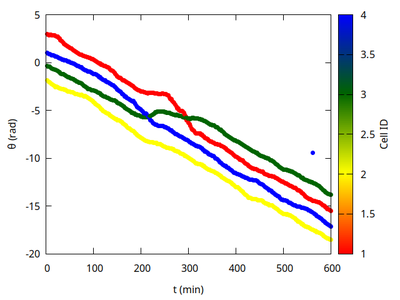
Note the mixing events when one cell increases its angular velocity (steeper portion in angle time course) to overtake another cell (flatter portion in angle time course).
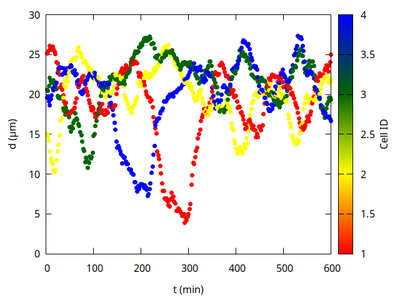
The distance of the overtaking cell from the quadruplet’s joint center of mass drops sharply as it takes the short cut through the quadruplet.
Example Movie
The simulation for the cell quadruplet shows collective rotations and the same mixing events (observe the blue cell overtaking other cells) as in the published Movie S7 by Lee et al..
Reference
This model is the original used in the publication, up to technical updates:
H. G. Lee, K. J. Lee: Neighbor-enhanced diffusivity in dense, cohesive cell populations. PLOS Computational Biology 17(9): e1009447, 2021.
Model
model.xml
XML Preview
<MorpheusModel version="4">
<Description>
<Title>Collective Motion</Title>
<Details>Full title: Collective Motion of MDA-MB-231 Breast Cancer Cells
Date: 20.08.2022
Authors: Hyun Gyu Lee, Kyoung J. Lee
Contributor: Lutz Brusch
Software: Morpheus (open-source), download from https://morpheus.gitlab.io
Time unit: minute
Space unit: micrometer
ModelID: https://identifiers.org/morpheus/M7678
Reference: This model reproduces the results in this publication in the latest Morpheus version which were originally obtained with the same model in an older Morpheus version:
Lee HG, Lee KJ (2021) Neighbor-enhanced diffusivity in dense, cohesive cell populations. PLOS Computational Biology 17(9): e1009447.
https://doi.org/10.1371/journal.pcbi.1009447
</Details>
</Description>
<Global>
<Constant symbol="dx" name="1 grid step = 3 µm" value="3"/>
<Constant symbol="dt" name="1 MCS = 2 min" value="2"/>
</Global>
<Space>
<Lattice class="square">
<Size symbol="size" value="100, 100, 0"/>
<Neighborhood>
<Distance>3</Distance>
</Neighborhood>
<BoundaryConditions>
<Condition type="periodic" boundary="x"/>
<Condition type="periodic" boundary="y"/>
</BoundaryConditions>
</Lattice>
<SpaceSymbol symbol="space"/>
</Space>
<Time>
<TimeSymbol symbol="time"/>
<StartTime value="0"/>
<StopTime value="400"/>
</Time>
<CellTypes>
<CellType name="medium" class="medium"/>
<CellType name="cancer_cell" class="biological">
<Property symbol="S" value="2.8"/>
<Property symbol="tmemory" value="4"/>
<VolumeConstraint target="100" strength="1"/>
<SurfaceConstraint target="0.9" strength="1" mode="aspherity"/>
<PersistentMotion decay-time="tmemory" strength="S"/>
<VariableVector symbol="com" value="0, 0, 0"/>
<VectorMapper name="com = center of mass">
<Input value="cell.center"/>
<Output symbol-ref="com" mapping="average"/>
</VectorMapper>
<Function symbol="d" name="d (µm)">
<Expression>dx*sqrt((cell.center.x-com.x)^2+(cell.center.y-com.y)^2)</Expression>
</Function>
<Function symbol="θ.MinusPiToPi">
<Expression>atan2(cell.center.y-com.y,cell.center.x-com.x)</Expression>
</Function>
<DelayProperty symbol="θ.last" name="θ of last time step" delay="1" value="0"/>
<Equation symbol-ref="θ.last">
<Expression>θ.MinusPiToPi</Expression>
</Equation>
<Property symbol="θ.turns" value="0"/>
<Function symbol="θ.unrolled" name="θ (rad)">
<Expression>θ.MinusPiToPi+θ.turns*2*pi</Expression>
</Function>
<System time-step="1" name="detect full turns around com" solver="Euler [fixed, O(1)]">
<Rule symbol-ref="θ.turns">
<Expression>θ.turns + (time>100)*(((θ.MinusPiToPi-θ.last)<(-1.95*pi)) - ((θ.MinusPiToPi-θ.last)>(1.95*pi)))</Expression>
</Rule>
</System>
</CellType>
</CellTypes>
<CPM>
<Interaction>
<Contact type2="medium" type1="cancer_cell" value="0"/>
<Contact type2="cancer_cell" type1="cancer_cell" value="-65"/>
<Contact type2="medium" type1="medium" value="0"/>
</Interaction>
<MonteCarloSampler stepper="edgelist">
<MCSDuration value="1"/>
<Neighborhood>
<Order>2</Order>
</Neighborhood>
<MetropolisKinetics temperature="10"/>
</MonteCarloSampler>
<ShapeSurface scaling="norm">
<Neighborhood>
<Distance>3</Distance>
</Neighborhood>
</ShapeSurface>
</CPM>
<CellPopulations>
<Population type="cancer_cell" size="0">
<!-- <Disabled>
<InitCircle random_displacement="0.0" name="cell doublet" mode="regular" number-of-cells="2">
<Dimensions center="50, 50, 0" radius="10"/>
</InitCircle>
</Disabled>
-->
<InitCircle random_displacement="0.0" name="cell quadruplet" mode="regular" number-of-cells="4">
<Dimensions center="50, 50, 0" radius="10"/>
</InitCircle>
<!-- <Disabled>
<InitRectangle name="dense population" mode="regular" number-of-cells="990">
<Dimensions origin="0.0, 0.0, 0.0" size="300, 300, 0.0"/>
</InitRectangle>
</Disabled>
-->
</Population>
</CellPopulations>
<Analysis>
<Gnuplotter time-step="5">
<Terminal name="png" size="300 300 0"/>
<Plot>
<Cells value="cell.id">
<ColorMap>
<Color color="red" value="1"/>
<Color color="yellow" value="2"/>
<Color color="green" value="3"/>
<Color color="blue" value="4"/>
</ColorMap>
</Cells>
<Disabled>
<CellArrows/>
</Disabled>
</Plot>
</Gnuplotter>
<Logger time-step="1">
<Input>
<Symbol symbol-ref="time.minutes"/>
<Symbol symbol-ref="θ.unrolled"/>
<Symbol symbol-ref="d"/>
<Symbol symbol-ref="cell.volume"/>
<Symbol symbol-ref="cell.surface"/>
<Symbol symbol-ref="cell.center.x"/>
<Symbol symbol-ref="cell.center.y"/>
<Disabled/>
</Input>
<Output>
<TextOutput/>
</Output>
<Plots>
<Plot>
<Style style="points"/>
<Terminal terminal="png"/>
<X-axis minimum="-size.x/2" maximum="size.x/2">
<Symbol symbol-ref="cell.center.xshifted"/>
</X-axis>
<Y-axis minimum="-size.y/2" maximum="2*size.y">
<Symbol symbol-ref="cell.center.yshifted"/>
</Y-axis>
<Color-bar minimum="1" maximum="3">
<Symbol symbol-ref="cell.id"/>
</Color-bar>
<Range>
<Time mode="history" history="300"/>
</Range>
</Plot>
<Plot>
<Style style="points"/>
<Terminal terminal="png"/>
<X-axis>
<Symbol symbol-ref="time.minutes"/>
</X-axis>
<Y-axis>
<Symbol symbol-ref="θ.unrolled"/>
</Y-axis>
<Color-bar minimum="1" maximum="3">
<Symbol symbol-ref="cell.id"/>
</Color-bar>
<Range>
<Time mode="history" history="300"/>
</Range>
</Plot>
<Plot>
<Style style="points"/>
<Terminal terminal="png"/>
<X-axis>
<Symbol symbol-ref="time.minutes"/>
</X-axis>
<Y-axis>
<Symbol symbol-ref="d"/>
</Y-axis>
<Color-bar minimum="1" maximum="3">
<Symbol symbol-ref="cell.id"/>
</Color-bar>
<Range>
<Time mode="history" history="300"/>
</Range>
</Plot>
</Plots>
</Logger>
<ModelGraph include-tags="#untagged" format="dot" reduced="false"/>
<Function symbol="time.minutes" name="t (min)">
<Expression>(time-100)*dt</Expression>
</Function>
<Function symbol="cell.center.yshifted" name="y (µm) shifted with time">
<Expression>(cell.center.y - size.y/2) * dx + (time-100)*0.7</Expression>
</Function>
<Function symbol="cell.center.xshifted" name="x (µm)">
<Expression>(cell.center.x - size.x/2) * dx</Expression>
</Function>
</Analysis>
</MorpheusModel>

Downloads
Files associated with this model: