Human ESC Colony Patterning
Persistent Identifier
Use this permanent link to cite or share this Morpheus model:
Introduction
The formation and maintenance of three germ layers in colonies of human embryonic stem cells (ESCs) is sensitive to the geometry of the colony. In vitro experiments with micropatterns controlling colony shape have previously addressed the underlying spatio-temporal patterning in Warmflash et al. 2014, Etoc et al. 2016 and Tewary et al. 2017.
This model by Fooladi et al. builds upon the three experimental and modeling works above and extends the basic principle of Waddington’s landscape by cell-cell communication. The model explores the experimentally observed sensitivity to colony geometry.
Description
- Units in the model are $[\text{space}] = \mathrm{\mu m}$, $[\text{time}] = \text{second}$.
- Parameter values were collected from literature by Fooladi et al..
- Boundary conditions are no-flux along the domain boundary by default.
- Domain shape is defined as binary TIFF image file and mimicks the cross section geometry of the gastrula.
- Initial condition: cells are placed within the imported spatial domain shape with approximately 90% confluence.
- The original model file was developed with Morpheus version 1.9.3 and was shared by the authors at GitHub
- The model file provided below has been updated (solver naming, added reference and links to description) such that it works with Morpheus version 2.2.4 and later and reproduces the original results.
Results
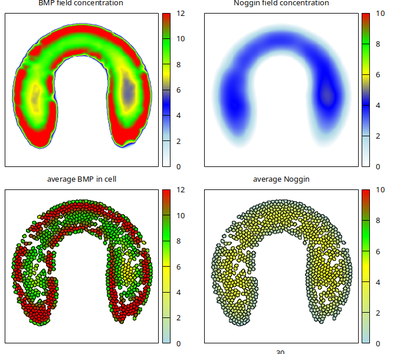
Running the model for 300 Monte Carlo steps from random initial conditions, self-organizes the BMP and Noggin expression patterns and ligand fields (see titles above each panel) as shown in this movie
and reproduces the published Figure 6d in Fooladi et al. as follows.
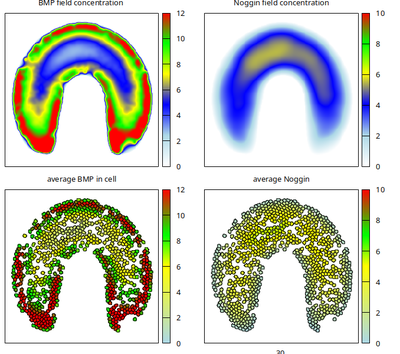
When the upper neck part of the domain shape is widened as in the published Figure 6c (with file Domain_6c.tif provided below), then more interior cell states will develop there with low BMP values around 2 (shown below).
Reference
This model is the original used in the publication, up to technical updates:
H. Fooladi, P. Moradi, A. Sharifi-Zarchi and B. Hosein Khalaj: Enhanced Waddington landscape model with cell–cell communication can explain molecular mechanisms of self organization. Bioinformatics 35 (20): 4081–4088, 2019.
Model
model.xml
XML Preview
<?xml version='1.0' encoding='UTF-8'?>
<MorpheusModel version="4">
    <Description>
        <Details>Full title:	Human ESC Colony Patterning
Date: 	27.08.2021
Authors: 	H. Fooladi, P. Moradi, A. Sharifi-Zarchi and B. Hosein Khalaj
Curators: 	H. Fooladi, L. Brusch
Software: 	Morpheus (open-source), download from https://morpheus.gitlab.io
ModelID: 	https://identifiers.org/morpheus/M7675
Units:	[space]=micrometer, [time]=second, [diffusion const]=micrometer^2/second
Reference:    This model is described in the peer-reviewed publication
	H. Fooladi, P. Moradi, A. Sharifi-Zarchi and B. Hosein Khalaj. Enhanced Waddington landscape model with cell--cell communication can explain molecular mechanisms of self organization. Bioinformatics 35 (20): 4081-4088, 2019.
	https://doi.org/10.1093/bioinformatics/btz201
</Details>
        <Title>Fooladi2019</Title>
    </Description>
    <Global>
        <Constant name="BMP production" symbol="a_1" value="0.1"/>
        <Constant name="Noggin Activation" symbol="beta_2" value="20"/>
        <Constant name="Noggin production" symbol="a_2" value="0.1"/>
        <Constant name="BMP Activation" symbol="beta_1" value="20"/>
        <Constant name="BMP inhibition" symbol="r1" value="0.1"/>
        <Constant name="binding ratio" symbol="r2" value="1"/>
        <Field name="BMP" symbol="b" value="5 + rand_norm(0,1.5)">
            <Diffusion rate="250"/>
        </Field>
        <Field name="Noggin" symbol="nog" value="isMedium*(0.1+  rand_uni(0,0.005))">
            <Diffusion rate="12500"/>
        </Field>
        <System time-step="0.02" solver="Euler-Maruyama [stochastic, O(1)]">
            <DiffEqn symbol-ref="b">
                <Expression>timeScale*((1.0-isMedium)*(beta_1*(b^n1)/(1 + b^n1 + nog^n1 + r1 * b^n1 * nog ^n1) - b +  a_1)- deg1*b*isMedium+ rand_norm(0,noise))</Expression>
            </DiffEqn>
            <DiffEqn symbol-ref="nog">
                <Expression>timeScale*((1.0-isMedium)*lambda*(beta_2*r2*(b^n2)/(1+r2*(b^n2))- nog +a_2) - deg2*nog*isMedium + rand_norm(0,noise))</Expression>
            </DiffEqn>
            <Constant name="noise" symbol="noise" value="1e-5"/>
            <Constant symbol="n2" value="2"/>
            <Constant symbol="n1" value="2"/>
            <Constant symbol="deg1" value="0.1"/>
            <Constant symbol="deg2" value="0.033"/>
        </System>
        <Constant name="degredation ratio" symbol="lambda" value="0.4"/>
        <Constant symbol="timeScale" value="1"/>
    </Global>
    <Space>
        <Lattice class="square">
            <Neighborhood>
                <Order>2</Order>
            </Neighborhood>
            <Size symbol="size" value="273, 273, 0"/>
            <Domain boundary-type="constant">
                <Image path="Domain_6d.tif"/>
            </Domain>
            <NodeLength value="4"/>
            <!--    <Disabled>
        <BoundaryConditions>
            <Condition type="constant" boundary="x"/>
            <Condition type="constant" boundary="y"/>
            <Condition type="constant" boundary="-x"/>
            <Condition type="constant" boundary="-y"/>
        </BoundaryConditions>
    </Disabled>
-->
        </Lattice>
        <SpaceSymbol symbol="l"/>
    </Space>
    <Time>
        <StartTime value="0"/>
        <StopTime symbol="end" value="30"/>
        <TimeSymbol symbol="time"/>
        <RandomSeed value="12345321"/>
    </Time>
    <CellTypes>
        <CellType name="stemCells" class="biological">
            <VolumeConstraint name="cellVol" strength="1" target="30"/>
            <Property name="average BMP in cell" symbol="avgBMP" value="0"/>
            <Property name="average Noggin" symbol="avgNog" value="0"/>
            <Constant symbol="isMedium" value="0.0"/>
            <Mapper name="Average BMP">
                <Input value="b"/>
                <Output symbol-ref="avgBMP" mapping="average"/>
            </Mapper>
            <Mapper name="Average Noggin">
                <Input value="nog"/>
                <Output symbol-ref="avgNog" mapping="average"/>
            </Mapper>
        </CellType>
        <CellType name="medium" class="medium">
            <Constant symbol="isMedium" value="1.0"/>
        </CellType>
    </CellTypes>
    <CellPopulations>
        <Population size="0" type="stemCells">
            <InitCircle number-of-cells="800" mode="random">
                <Dimensions center="size.x/2,size.y/2,0" radius="size.x/2"/>
            </InitCircle>
        </Population>
    </CellPopulations>
    <Analysis>
        <Gnuplotter time-step="1.0" decorate="true">
            <Plot title="BMP field concentration ">
                <Field min="0.0" symbol-ref="b" max="12">
                    <ColorMap>
                        <Color color="white" value="0.0"/>
                        <Color color="light-blue" value="0.2"/>
                        <Color color="blue" value="0.4"/>
                        <Color color="yellow" value="0.6"/>
                        <Color color="green" value="0.8"/>
                        <Color color="red" value="1.0"/>
                    </ColorMap>
                </Field>
            </Plot>
            <Plot title="Noggin field concentration">
                <Field min="0.0" symbol-ref="nog" max="10">
                    <ColorMap>
                        <Color color="white" value="0.0"/>
                        <Color color="light-blue" value="0.2"/>
                        <Color color="blue" value="0.4"/>
                        <Color color="yellow" value="0.6"/>
                        <Color color="green" value="0.8"/>
                        <Color color="red" value="1.0"/>
                    </ColorMap>
                </Field>
            </Plot>
            <Plot title="">
                <Cells min="0.0" max="12" value="avgBMP">
                    <ColorMap>
                        <Color color="light-blue" value="0.0"/>
                        <Color color="red" value="1.0"/>
                        <Color color="yellow" value="0.5"/>
                        <Color color="green" value="0.7"/>
                    </ColorMap>
                </Cells>
            </Plot>
            <Plot>
                <Cells min="0.0" max="10" value="avgNog">
                    <ColorMap>
                        <Color color="light-blue" value="0.0"/>
                        <Color color="red" value="1.0"/>
                        <Color color="yellow" value="0.5"/>
                        <Color color="green" value="0.7"/>
                    </ColorMap>
                </Cells>
            </Plot>
            <Terminal name="png"/>
        </Gnuplotter>
        <!--    <Disabled>
        <Logger time-step="30">
            <Input>
                <Symbol symbol-ref="b"/>
            </Input>
            <Output>
                <TextOutput file-numbering="time" file-name="BMP" file-format="csv" header="true" separator="comma"/>
            </Output>
        </Logger>
    </Disabled>
-->
        <!--    <Disabled>
        <Logger time-step="30">
            <Input>
                <Symbol symbol-ref="nog"/>
            </Input>
            <Output>
                <TextOutput file-numbering="time" file-name="Nog" file-format="csv" header="true" separator="comma"/>
            </Output>
        </Logger>
    </Disabled>
-->
        <ModelGraph format="dot" reduced="false" include-tags="#untagged"/>
    </Analysis>
    <CPM>
        <Interaction default="0.0">
            <Contact type2="stemCells" type1="medium" value="5"/>
            <Contact type2="stemCells" type1="stemCells" value="10"/>
        </Interaction>
        <ShapeSurface scaling="norm">
            <Neighborhood>
                <Order>2</Order>
            </Neighborhood>
        </ShapeSurface>
        <MonteCarloSampler stepper="edgelist">
            <MetropolisKinetics temperature="1"/>
            <Neighborhood>
                <Order>2</Order>
            </Neighborhood>
            <MCSDuration value="0.1"/>
        </MonteCarloSampler>
    </CPM>
</MorpheusModel>

Downloads
Files associated with this model: