MDCK EMT A
Persistent Identifier
Use this permanent link to cite or share this Morpheus model:
Multiscale simulation of EMT by minimal signaling circuit
Introduction
We model epithelial-mesenchymal transition (EMT) by first assembling an ODE model for intracellular Yes-associated protein (YAP) signalling and then embedding this single cell model within individual cells in a multiscale simulation.
Description
A simple single cell ODE model describing the YAP, Rac1, and E-cadherin interaction is constructed. Building upon several assumptions, this single cell model is adapted to a multiscale simulation of a two-dimensional wound-healing experiment based on Park et al. (2019). Nanoridge arrays (NRAs) provide directional cues to epithelial sheet expansion.
Results
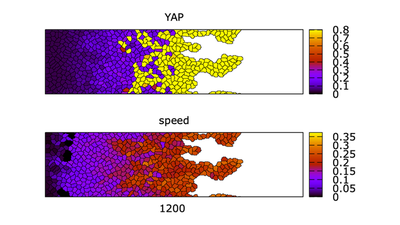
Video of the model simulation YREsheetNRA_main.xml: Formation of fingers in the multiscale simulation of a control cell sheet on topographic (NRA) substrate showing sheet morphology colored for YAP (top) and cell speed (bottom) (StopTime = 1500, $100\ \text{MCS} \approx 1\ h$). Cells near the front of the sheet have high YAP. In the middle of the sheet, there is a mixture of cell states (see also Fig. 2 in the referenced paper).
The simulated cell trajactories shown below align qualitatively with the experimental results from Park et al. (2019) on substrates.
; right, **NRA** substrate: [`CellTrajCntr_NRA.xml`](#downloads).](/media/model/m7121/Fig3_hub630a41ddb04c6e9bf6170d90fbdaf6d_1195484_137abb45efdf62bcb1469c3f50553a4e.png)
CellTrajCntr_Flat.xml; right, NRA substrate: CellTrajCntr_NRA.xml.
Video of the model simulation CellTrajCntr_Flat.xml: Trajectories for cell sheets grown on flat substrates. Speed scaled to experimentally observed range (see also Fig. 3 in the referenced paper).
Video of the model simulation CellTrajCntr_NRA.xml: Trajectories for cell sheets grown on NRA substrates. Speed scaled to experimentally observed range (see also Fig. 3 in the referenced paper).
Reference
This model is the original used in the publication, up to technical updates:
N. Mukhtar, E. N. Cytrynbaum, L. Edelstein-Keshet: A multiscale computational model of YAP signaling in epithelial fingering behavior. Biophys. J. 121 (10): 1940-1948, 2022.
Model
YREsheetNRA_main.xml
XML Preview
<?xml version='1.0' encoding='UTF-8'?>
<MorpheusModel version="4">
<Description>
<Details>Naba Mukhtar, Eric N Cytrynbaum, and Leah Edelstein-Keshet (2022) A Multiscale computational model of YAP signaling in epithelial fingering behaviour.
This xml file was used to produce Figure 2, SI Figure 6, 10
A multiscale model of a control cell sheet on nano-ridge arrays with the YAP-Rac-E cadherin circuit based on experiments by
Park, J., Kim, D.H., Shah, S.R., Kim, H.N., Kim, P., Quiñones-Hinojosa, A. and Levchenko, A., 2019. Switch-like enhancement of epithelial-mesenchymal transition by YAP through feedback regulation of WT1 and Rho-family GTPases. Nature communications, 10(1), pp.1-15.
The sheet morphology over 15 hrs and 400 micro-meters distance . On nano-ridge arrays (NRAs) a few edge cells get a high Rac1 activation rate to mimic the mechanostimulation by the topography.
This simulation is the "control" YAP case.
We thank Lutz Brusch for providing a basic cell sheet simulation that we modified and adapted to this project </Details>
<Title>YREsheetNRA</Title>
</Description>
<Space>
<Lattice class="square">
<Neighborhood>
<Order>2</Order>
</Neighborhood>
<Size value="400, 100, 0" symbol="size"/>
<BoundaryConditions>
<Condition boundary="x" type="constant"/>
<Condition boundary="-x" type="noflux"/>
<Condition boundary="y" type="periodic"/>
<Condition boundary="-y" type="periodic"/>
</BoundaryConditions>
</Lattice>
<SpaceSymbol symbol="space"/>
</Space>
<Time>
<StartTime value="0"/>
<StopTime value="1500" symbol="stoptime"/>
<TimeSymbol symbol="time"/>
<RandomSeed value="1"/>
</Time>
<Analysis>
<Gnuplotter decorate="true" time-step="50">
<Terminal name="png"/>
<Plot>
<Cells flooding="true" value="Y">
<Disabled>
<ColorMap>
<Color value="0" color="lemonchiffon"/>
<Color value="0.05" color="light-blue"/>
<Color value="0.1" color="light-red"/>
</ColorMap>
</Disabled>
</Cells>
</Plot>
<Plot title="Rac1">
<Cells flooding="true" min="0" max="3" value="R">
<ColorMap>
<Color value="0" color="blue"/>
<Color value="3" color="red"/>
<Color value="4" color="yellow"/>
</ColorMap>
</Cells>
</Plot>
<Plot>
<Cells flooding="true" min="0" max="2" value="E">
<Disabled>
<ColorMap>
<Color value="0" color="plum"/>
<Color value="4" color="blue"/>
<Color value="7" color="cyan"/>
</ColorMap>
</Disabled>
</Cells>
</Plot>
<Plot>
<Cells flooding="true" value="d.abs">
<!-- <Disabled>
<ColorMap>
<Color value="0" color="skyblue"/>
<Color value="0.1" color="violet"/>
<Color value="0.2" color="salmon"/>
</ColorMap>
</Disabled>
-->
</Cells>
</Plot>
<!-- <Disabled>
<Plot>
<Cells value="Cr" flooding="true">
<Disabled>
<ColorMap>
<Color value="0" color="red"/>
<Color value="0" color="red"/>
</ColorMap>
</Disabled>
</Cells>
</Plot>
</Disabled>
-->
</Gnuplotter>
<Logger time-step="1.0">
<Input>
<Symbol symbol-ref="cell.center.x"/>
<Symbol symbol-ref="cell.center.y"/>
</Input>
<Output>
<TextOutput/>
</Output>
<Plots>
<Plot time-step="300">
<Style point-size="0.05" style="points"/>
<Terminal terminal="png"/>
<X-axis minimum="0.0" maximum="size.x">
<Symbol symbol-ref="cell.center.x"/>
</X-axis>
<Y-axis minimum="0.0" maximum="size.y">
<Symbol symbol-ref="cell.center.y"/>
</Y-axis>
<Color-bar minimum="0.0" palette="rainbow" maximum="0.3">
<Symbol symbol-ref="d.abs"/>
</Color-bar>
</Plot>
</Plots>
</Logger>
<ModelGraph include-tags="#untagged" format="dot" reduced="false"/>
</Analysis>
<Global>
<Constant value="0.1" name="Basal rate of YAP activation" symbol="ky"/>
<Constant value="1.8" name="E-cadherin-dependent rate of YAP deactivation" symbol="kye"/>
<Constant value="2" name="Inactivation rate of YAP" symbol="Dy"/>
<Constant value="0.9" name="Initial activation rate of E-cadherin" symbol="C"/>
<Constant value="0.9" name="YAP-dependent rate of E-cadherin expression" symbol="ke"/>
<Constant value="1" name="Dissociation constant of YAP-WT1 transcriptional constant" symbol="K"/>
<Constant value="1" name="Inactivation rate of E-cadherin" symbol="De"/>
<Constant value="3" name="Hill coefficient for E-cadherin" symbol="h"/>
<Constant value="1" name="YAP-dependent rate of Rac1 expression" symbol="kr"/>
<Constant value="0.5" name="Michaelis-Menten-like constant for Rac1" symbol="Kr"/>
<Constant value="0.5" name="Degradation rate of Rac1" symbol="Dr"/>
<Constant value="6" name="Hill coefficient for Rac1" symbol="n"/>
<Constant value="1" name="Rac activation fraction" symbol="alphaR"/>
<Constant value="1.8" name="Rac1-dependent rate of YAP activation" symbol="kyr"/>
<!-- <Disabled>
<Constant value="2" symbol="A2" name="basal adhesion">
<Annotation>E-cad blocking</Annotation>
</Constant>
</Disabled>
-->
<Constant value="12" name="Max E-cadherin adhesion constant" symbol="A2">
<Annotation>Control</Annotation>
</Constant>
<Constant value="0.85" name="E-cadherin half "saturation" " symbol="A3"/>
<Constant value="0.4" name="basal migration" symbol="C1"/>
<Constant value="4" name="Max Rac1 migration constant" symbol="C2"/>
<Constant value="3" name="Rac1 half "saturation"" symbol="C3"/>
<Constant value="100" name="max time for initial leader cells to emerge" symbol="tlim"/>
<Constant value="0.2" name="fraction of neighbourhood Cr that the cell receives each time Cr spreads to it" symbol="frac"/>
<!-- <Disabled>
<Constant value="0.5" symbol="Ytot" name="Total YAP (active (Y) + inactive)">
<Annotation>KD</Annotation>
</Constant>
</Disabled>
-->
<Constant value="1.2" name="Total YAP (active (Y) + inactive)" symbol="Ytot">
<Annotation>Control</Annotation>
</Constant>
<!-- <Disabled>
<Constant value="2" symbol="Ytot" name="Total YAP (active (Y) + inactive)">
<Annotation>OE</Annotation>
</Constant>
</Disabled>
-->
<Constant value="5" name="Total Rac1 (active (R) + inactive)" symbol="Rtot"/>
<Constant value="0.02" name="parameter that determines probability of Cr spread in each time step" symbol="shareprob"/>
<Variable value="0.0" name="E-cadherin" symbol="E"/>
<Variable value="0.0" name="Basal Rac1 activation rate" symbol="Cr"/>
<!-- <Disabled>
<Variable value="0.0" symbol="x_edge2"/>
</Disabled>
-->
<!-- <Disabled>
<Mapper name="leftmost edge cell" time-step="1.0">
<Input value="(M>0)*cell.center.x*(cell.center.x>10) + (M==0)*size.x + (M>0)*size.x*(cell.center.x<=10)"/>
<Output mapping="minimum" symbol-ref="x_edge2"/>
</Mapper>
</Disabled>
-->
</Global>
<CellTypes>
<CellType name="medium" class="medium"/>
<CellType name="dividingcell" class="biological">
<VolumeConstraint strength="1" target="50"/>
<ConnectivityConstraint/>
<SurfaceConstraint mode="aspherity" strength="1" target="1"/>
<CellDivision division-plane="major">
<Condition>(rand_uni(0,1)<0.006*(exp(-time/300)+0.2)) * (cell.center.x<40)</Condition>
<Triggers/>
<Annotation>Only cells in the first 40 pixels can divide, regardless of domain size. Before, this was size.x*0.1</Annotation>
</CellDivision>
<CellDeath name="delete cells near right domain edge">
<Condition>(cell.center.x>0.99*size.x)</Condition>
</CellDeath>
<DirectedMotion direction="1, 0.0, 0.0" name="cell migration" strength="C1+C2*R/(C3+R)"/>
<Property value="0" name="YAP" symbol="Y"/>
<Property value="10" name="E-cadherin" symbol="E"/>
<Property value="0" name="Rac1" symbol="R"/>
<Property value="0.001" symbol="Cr"/>
<Property value="0.0" name="distance from right domain edge" symbol="dist"/>
<Property value="0.0" name="Sum of instantaneous speeds each time step (times 100)" symbol="avspeed"/>
<Property value="0.0" name="Average Speed * 100" symbol="truavspeed"/>
<Property value="0.0" name="Sum of instantaneous speeds over final 200 time steps (times 100)" symbol="avspeed2"/>
<Property value="0.0" name="average speed over final 200 time steps (times 100)" symbol="truavspeed2"/>
<Property value="0.0" name="Contact with medium" symbol="M"/>
<Property value="0.0" name="number of neighbour cells" symbol="neigh"/>
<Property value="0.0" name="average neighbourhood Cr" symbol="av"/>
<PropertyVector value="0.0, 0.0, 0.0" name="speed" symbol="d"/>
<NeighborhoodReporter>
<Input value="cell.type == celltype.medium.id" scaling="length"/>
<Output mapping="sum" symbol-ref="M"/>
</NeighborhoodReporter>
<NeighborhoodReporter>
<Input value="cell.type == celltype.dividingcell.id" scaling="cell"/>
<Output mapping="sum" symbol-ref="neigh"/>
</NeighborhoodReporter>
<NeighborhoodReporter>
<Input value="Cr" scaling="cell"/>
<Output mapping="average" symbol-ref="av"/>
</NeighborhoodReporter>
<MotilityReporter time-step="50">
<Velocity symbol-ref="d"/>
</MotilityReporter>
<System solver="Dormand-Prince [adaptive, O(5)]">
<DiffEqn name="Equation for YAP" symbol-ref="Y">
<Expression>(ky+kyr*R)*(Ytot-Y) - (kye*Y*E + Dy*Y)</Expression>
</DiffEqn>
<DiffEqn name="Equation for E-cadherin" symbol-ref="E">
<Expression>C - ke*Y^h/(K^h+Y^h) - De*E</Expression>
</DiffEqn>
<DiffEqn name="Equation for Rac1" symbol-ref="R">
<Expression>alphaR*(Cr + kr*Y^n/(Kr^n+Y^n))*(Rtot-R) - Dr*R</Expression>
</DiffEqn>
<Rule name="Equation for Cr spread; at each time step before tlim, cells in contact with the medium have a small chance of being endowed with high Cr; at each time step, each cell has a small chance of having its Cr be augmented by the average neighbourhood Cr (up to a max value); cells at the left edge of the domain retain low Cr" symbol-ref="Cr">
<Expression>Cr+(0.1*(M>8)*(rand_uni(0,1)<0.008)*(time<tlim)+frac*av*(rand_uni(0,1)<shareprob))*(Cr<0.1)*(cell.center.x>20)</Expression>
</Rule>
<Rule name="distance from right domain edge" symbol-ref="dist">
<Expression>size.x - cell.center.x</Expression>
</Rule>
<Rule name="Sum of instantaneous speeds each time step (times 100)" symbol-ref="avspeed">
<Expression>avspeed+d.abs*100</Expression>
</Rule>
<Rule name="average speed over the simulation (times 100)" symbol-ref="truavspeed">
<Expression>avspeed/time</Expression>
</Rule>
<Rule name="Sum of instantaneous speeds over final 100 time steps (times 100)" symbol-ref="avspeed2">
<Expression>avspeed2 + d.abs*100*(time > stoptime-201)</Expression>
</Rule>
<Rule name="average speed over 100 time steps (times 100)" symbol-ref="truavspeed2">
<Expression>avspeed2/200</Expression>
</Rule>
</System>
</CellType>
</CellTypes>
<CellPopulations>
<Population name="Initialize cell sheet at left edge of the domain" type="dividingcell" size="1">
<!-- <Disabled>
<InitRectangle mode="regular" number-of-cells="70">
<Dimensions origin="size.x/100, 0, 0" size="size.x/100, size.y, size.z"/>
</InitRectangle>
</Disabled>
-->
<InitRectangle mode="regular" number-of-cells="70">
<Dimensions origin="0.0, 0.0, 0.0" size="4.0, size.y, 0.0"/>
</InitRectangle>
</Population>
</CellPopulations>
<CPM>
<Interaction>
<Contact type2="dividingcell" value="30" type1="dividingcell">
<AddonAdhesion name="Adhesive strength" strength="5" adhesive="A2*E/(A3+E)"/>
</Contact>
<Contact type2="medium" value="12" type1="dividingcell"/>
</Interaction>
<ShapeSurface scaling="norm">
<Neighborhood>
<Order>2</Order>
</Neighborhood>
</ShapeSurface>
<MonteCarloSampler stepper="edgelist">
<MCSDuration value="1"/>
<MetropolisKinetics temperature="1"/>
<Neighborhood>
<Order>2</Order>
</Neighborhood>
</MonteCarloSampler>
</CPM>
</MorpheusModel>

YREsheetNRA_main.xml
For more information on the models discussed here,
YREsheetNRA_main.xml(produced Fig. 2),CellTrajCntr_Flat.xml(produced Fig. 3) andCellTrajCntr_NRA.xml(produced Fig. 3),
see the referenced paper.
For information on models
nra.xml(produced Fig. 4),YREcells.xml(produced SI Fig. S3),YREodes.xml(produced SI Fig. S2) andYREsheetFlat.xml(produced SI Fig. S4)
which are here attached but not discussed, please refer to the supplemental information of the referenced paper.
Downloads
Files associated with this model: