Chemotaxis for Model Checking
Persistent Identifier
Use this permanent link to cite or share this Morpheus model:
Introduction
Comparison of spatio-temporal model output to experimental measurements or between model variants all require the application of summary statistics.
For multicellular models, statistical properties of the cell configuration at given times or across time are of interest and Morpheus provides some Analysis/Trackers for that: CellTracker, DisplacementTracker, ClusteringTracker and ContactLogger.
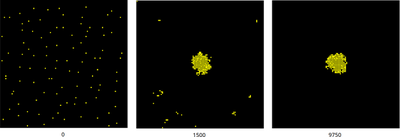
To further capture the spatial shape of cell clusters and other properties, Pârvu and Gilbert have used the spatio-temporal markup language (STML), see Pârvu et al. and their figure below.
 ([*CC BY 2.0*](https://creativecommons.org/licenses/by/2.0/): [**Pârvu _et al._**](#reference)). Time `t` counts output iterations which are written every 50 MCS.](/media/model/m5496/12918_2014_Article_124_Fig8_HTML_hub1b30a0a1c64c3a8ea0cb0553e6a6017_134533_266d6a9fb674f31bdf722b1b27d3c990.jpg)
t counts output iterations which are written every 50 MCS.
The STML-encoded model results were then evaluated in the model checker Mudi and compared to specified behaviour using probabilistic rules. Mudi is an approximate probabilistic model checking platform that provides frequentist and Bayesian approaches for statistical hypothesis testing and model validation. Note, the software Mudi was published on the webpage http://mudi.modelchecking.org but this is no longer online. The internet archive holds a copy of the Mudi webpage from 2016. The stochastic simulations had to be repeated many times (here by Mudi calling the Morpheus simulator without GUI on command line) to sample from the distribution of outcomes.
Model Description
Space is discretized as a 2D square lattice with a lattice spacing (and spatial length unit) corresponding to 1 cell diameter.
A static scalar field U(x,y) provides the chemoattractant.
100 cells are initialized at random positions and the CPM dynamics accounts for random motility, chemotaxis and cell-cell adhesion.
The original model file was published as electronic supplementary material 12918_2014_124_MOESM9_ESM.zip and is also included in the download section below as model_published.xml.
This published model was run in the Morpheus version of 2014 and encoded in <MorpheusModel version="1">.
We’ve updated the model to the current <MorpheusModel version="4"> such that it runs in the latest version of Morpheus.
This updated model.xml is provided here.
Results
Due to cell-cell adhesion, various cell clusters form during the chemotactic aggregation process until all cells have reached the single large cluster at the maximum of the static chemoattractant field. This process is visualized in the movie below (using the updated model.xml), where cells are shown yellow and the field U(x,y) in greyscale.
Simulation snapshots qualitatively reproduce the results in the published Fig.8 above. Note, both are single samples of the stochastic process.
t above, e.g. 195 * 50 MCS = 9750 MCS).
Reference
This model is the original used in the publication, up to technical updates:
O. Pârvu, D. Gilbert: Automatic validation of computational models using pseudo-3D spatio-temporal model checking.. BMC Systems Biology 8: 124, 2014.
Model
model.xml
XML Preview
<?xml version='1.0' encoding='UTF-8'?>
<MorpheusModel version="4">
    <Description>
        <Title>Parvu2014</Title>
        <Details>Full title: Chemotaxis for Model Checking
Date:   13.03.2023
Authors:        O. Pârvu, D. Gilbert
Curators:       L. Brusch
Software:       Morpheus (open source). Download from: https://morpheus.gitlab.io
Model ID:       https://identifiers.org/morpheus/M5496
Units:	[time] = a.u.
	[space] = 1 cell diameter
Reference:      This model is the original used in the publication, up to technical updates:
       O. Pârvu, D. Gilbert: Automatic validation of computational models using pseudo-3D spatio-temporal model checking. BMC Systems Biology 8:124, 2014.
       https://doi.org/10.1186/s12918-014-0124-0
</Details>
    </Description>
    <Space>
        <Lattice class="square">
            <Neighborhood>
                <Order>2</Order>
            </Neighborhood>
            <Size symbol="s" value="100.0, 100.0, 0.0"/>
            <BoundaryConditions>
                <Condition type="noflux" boundary="x"/>
                <Condition type="noflux" boundary="-x"/>
                <Condition type="noflux" boundary="y"/>
                <Condition type="noflux" boundary="-y"/>
            </BoundaryConditions>
        </Lattice>
        <SpaceSymbol symbol="l"/>
    </Space>
    <Time>
        <StartTime value="0"/>
        <StopTime value="1e4"/>
        <TimeSymbol symbol="time"/>
    </Time>
    <Global>
        <Field symbol="U" name="chemoattractant" value="exp(1- ( (( l.x-((s.x + 1) / 2))^2)/(2*sigma)^2 + (( l.y-((s.y + 1) / 2) )^2)/(2*sigma)^2 ))">
            <Diffusion rate="0.0"/>
        </Field>
        <Constant symbol="sigma" name="sigma" value="10"/>
    </Global>
    <CPM>
        <Interaction default="0.0">
            <Contact type2="medium" type1="cells" value="0"/>
            <Contact type2="cells" type1="cells" value="-20"/>
        </Interaction>
        <ShapeSurface scaling="norm">
            <Neighborhood>
                <Order>optimal</Order>
            </Neighborhood>
        </ShapeSurface>
        <MonteCarloSampler stepper="edgelist">
            <MCSDuration value="1"/>
            <MetropolisKinetics temperature="10"/>
            <Neighborhood>
                <Order>2</Order>
            </Neighborhood>
        </MonteCarloSampler>
    </CPM>
    <CellTypes>
        <CellType name="medium" class="medium">
            <Property symbol="p" name="production chemoattractant" value="0"/>
            <Property symbol="cell" value="0"/>
        </CellType>
        <CellType name="cells" class="biological">
            <Property symbol="neighbors" name="number of neighboring cells" value="0"/>
            <VolumeConstraint target="1" strength="1"/>
            <SurfaceConstraint target="0.85" strength="1" mode="aspherity"/>
            <Chemotaxis strength="100" field="U"/>
        </CellType>
    </CellTypes>
    <CellPopulations>
        <Population type="cells" name="Cells" size="1">
            <InitRectangle mode="regular" random-offset="10" number-of-cells="100">
                <Dimensions origin="5, 5, 0" size="95, 95, 0"/>
            </InitRectangle>
        </Population>
    </CellPopulations>
    <Analysis>
        <ModelGraph include-tags="#untagged" format="svg" reduced="false"/>
        <Logger time-step="50">
            <Input>
                <Symbol symbol-ref="cell.center.x"/>
                <Symbol symbol-ref="cell.center.y"/>
            </Input>
            <Output>
                <TextOutput/>
            </Output>
        </Logger>
        <Gnuplotter time-step="50">
            <Plot>
                <Cells max="1" min="0" value="cell.type"/>
                <Field symbol-ref="U">
                    <ColorMap>
                        <Color color="black" value="0"/>
                        <Color color="white" value="2"/>
                    </ColorMap>
                </Field>
            </Plot>
            <Terminal name="png"/>
        </Gnuplotter>
    </Analysis>
</MorpheusModel>

Downloads
Files associated with this model: