Three Layer Circuit
Persistent Identifier
Use this permanent link to cite or share this Morpheus model:
Introduction
This model combines simple Notch signaling with the cellular Potts model (CPM), which drives cell sorting as a result of differential adhesion. Model details are contained in the reference Mulberry and Keshet, 2020.
This experiment adds to the setup of the Two Layer Circuit by allowing both A and B type cells to act as senders or receivers. The cells eventually self-organize into a stable three-layer structure.
Description
We define two cells types, each with sender and receiver capabilities, although for two different signaling pathways.
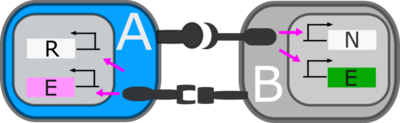
We have defined two ligand–receptor pairs, D–N and G–R (see schematic diagram above). The A-type cell expresses D, which activates neighboring N on B-type cells. Activation induces the B-type cells to express E-cadhi, and ligand G. The G ligand can subsequently activate neighboring R on A-type cells, which induces expression of E-cad at low levels (E-cadlo). The model equations for the A-type cells (encoding D ligand and R receptor) are
$$\begin{align} \frac{\mathrm dR}{\mathrm dt} &= R_0 \left(1 + \frac{I^p}{I_0^p+I^p}\right) - \kappa_tRG_\text{ext} - \gamma R \\ \frac{\mathrm dI}{\mathrm dt} &= \kappa_tRT_\text{ext}- \gamma_I I \\ \frac{\mathrm dE^\text{lo}}{\mathrm dt} &= E_0^\text{lo} \frac{I^p}{I_0^p+I^p} - \gamma E^\text{lo} \\ \frac{\mathrm dD}{\mathrm dt} &= D_0 - \kappa_tN_\text{ext}D - \gamma D \\ \end{align}$$
To account for a lower maximal level of E-cad in activated A-type cells than for B-type cells, we scale $E^\text{lo} = E/3$.
The corresponding equations for the B-type cells (encoding G ligand and N receptor) are
$$\begin{align} \frac{\mathrm dN}{\mathrm dt} &= N_0 \left(1 + \frac{I^p}{I_0^p+I^p}\right) - \kappa_tND_\text{ext}-\gamma N \\ \frac{\mathrm dI}{\mathrm dt} &= \kappa_tND_\text{ext}- \gamma_I I\\ \frac{\mathrm dE^\text{hi}}{\mathrm dt} &= E_0^\text{hi} \frac{I^p}{I_0^p+I^p} - \gamma E^\text{hi}\\ \frac{\mathrm dG}{\mathrm dt} &= D_0 - \kappa_tR_\text{ext}G - \gamma G \\ \end{align}$$
Results
Reference
This model is described in the peer-reviewed publication:
N. Mulberry, L. Edelstein-Keshet: Self-organized Multicellular Structures from Simple Cell Signaling: A Computational Model. Phys. Biol. 17: 066003, 2020.
Our computational model was inspired by the experimental work of Toda et al., 2018. The Notch signaling model was based on that of Boareto et al., 2015.
Model
ThreeLayerCircuit.xml
XML Preview
<MorpheusModel version="4">
    <Description>
        <Title>Three Layer Circuit</Title>
        <Details>
            Two distinct cell types: a sender cell A and a receiver cell B.
            The B-type cells are induced by A to express cadherin, which leads to
            cell sorting. Additionally, the A-type cells can be induced to express a lower strenght cadherin.
            For certain parameter values, a three-layer structure emerges. Blue colour indicates the undifferentiated A-type cells, pink colour indicates the differentiated A-type cells, and green colour indicates differentiated B-type cells.

            Reference:
            The model is decribed in "Self-organized multicellular structures from simple cell signaling: a computational model",
            N.Mulberry and L.Edelstein-Keshet, Physical Biology 2020, https://doi.org/10.1088/1478-3975/abb2dc
      </Details>
    </Description>
    <Global>
        <Variable symbol="N" value="0"/>
        <Variable symbol="D" value="0"/>
        <Variable symbol="I" value="0"/>
        <Variable symbol="E" value="0"/>
        <Variable symbol="G" value="0"/>
        <Variable symbol="R" value="0"/>
        <Variable symbol="colour" value="0"/>
    </Global>
    <Space>
        <SpaceSymbol symbol="l"/>
        <Lattice class="square">
            <Size symbol="size" value="300, 300, 0"/>
            <BoundaryConditions>
                <Condition boundary="x" type="noflux"/>
                <Condition boundary="y" type="noflux"/>
            </BoundaryConditions>
            <Neighborhood>
                <Order>1</Order>
            </Neighborhood>
        </Lattice>
    </Space>
    <Time>
        <StartTime value="0"/>
        <StopTime value="2e2"/>
        <TimeSymbol symbol="time"/>
    </Time>
    <CellTypes>
       <!-- A type cells: can be driven to express Ecadlo -->
       <CellType class="biological" name="A">
            <VolumeConstraint target="200" strength="1"/>
            <Property symbol="R" value="0.0" name="GFP_receptor"/>
            <Property symbol="Gn" value="0.0" name="GFPligand_neighbour"/>
            <Property symbol="Nn" value="0.0" name="synNotch_neighbour"/>
            <Property symbol="D" value="3e3" name="CD19ligand"/>
            <Property symbol="I" value="0.0" name="NICD"/>
            <Property symbol="E1" value="0.0" name="Ecad" /> <!-- intermediate, for ODE -->
            <Property symbol="E" value="0.0" name="Ecadlo" />
            <Property symbol="colour" value="-1" />
            <NeighborhoodReporter>
                <Input scaling="cell" value="N"/>
                <Output symbol-ref="Nn" mapping="average"/>
            </NeighborhoodReporter>
            <NeighborhoodReporter>
                <Input scaling="cell" value="G"/>
                <Output symbol-ref="Gn" mapping="average"/>
            </NeighborhoodReporter>
            <System solver="runge-kutta" time-step="0.1" time-scaling="1">
                <Constant symbol="Kt" value="5e-5"/>
                <Constant symbol="N0" value="500"/>
                <Constant symbol="I0" value="200"/>
                <Constant symbol="D0" value="1000"/>
                <Constant symbol="E0" value="2"/>
                <Constant symbol="gammaI" value="0.5"/>
                <Constant symbol="gamma" value="0.1"/>
                <Constant symbol="p" value="2"/>
                <DiffEqn symbol-ref="R">
                    <Expression>N0*(1+I^p/(I0^p+I^p)) - Kt*R*Gn - gamma*R</Expression>
                </DiffEqn>
               <DiffEqn symbol-ref="I">
                    <Expression>Kt*R*Gn - gammaI*I </Expression>
                </DiffEqn>
                <DiffEqn symbol-ref="E1">
                    <Expression> (I^p/(I0^p+I^p) - gamma*E1) </Expression>
                </DiffEqn>
                <DiffEqn symbol-ref="D">
                    <Expression> D0 - Kt*D*Nn - gamma*D </Expression>
                </DiffEqn>
               <Rule symbol-ref="E"> <!-- scale down -->
                    <Expression> E1/3 </Expression>
                </Rule>
               <Rule symbol-ref="colour">
                    <Expression> -1 - 3*E/10</Expression>
                </Rule>
            </System>
        </CellType>
       <!-- B type cells: can be driven to express Ecadhi -->
       <CellType class="biological" name="B">
            <VolumeConstraint target="200" strength="1"/>
            <Property symbol="G" value="0.0" name="GFPligand"/>
            <Property symbol="Rn" value="0.0" name="GFPreceptor_Neighbours"/>
            <Property symbol="N" value="1e3" name="synNotch (CD19 receptor)"/>
            <Property symbol="Dn" value="0.0" name="CD19ligand_Neighbours"/>
            <Property symbol="I" value="0.0" name="NICD"/>
            <Property symbol="E" value="0.0" name="Ecad" />
            <Property symbol="colour" value="0.0" />
            <NeighborhoodReporter>
                <Input scaling="cell" value="D"/>
                <Output symbol-ref="Dn" mapping="average"/>
            </NeighborhoodReporter>
            <NeighborhoodReporter>
                <Input scaling="cell" value="R"/>
                <Output symbol-ref="Rn" mapping="average"/>
            </NeighborhoodReporter>
            <System solver="runge-kutta" time-step="0.1" time-scaling="1">
                <Constant symbol="Kt" value="5e-5"/>
                <Constant symbol="N0" value="500"/>
                <Constant symbol="G0" value="1000"/>
                <Constant symbol="I0" value="200"/>
                <Constant symbol="gammaI" value="0.5"/>
                <Constant symbol="gamma" value="0.1"/>
                <Constant symbol="p" value="2"/>
                <Constant symbol="E0" value="2"/>
                <DiffEqn symbol-ref="N">
                    <Expression>N0*(1+I^p/(I0^p+I^p)) - Kt*N*Dn - gamma*N</Expression>
                </DiffEqn>
               <DiffEqn symbol-ref="I">
                    <Expression>Kt*N*Dn - gammaI*I </Expression>
                </DiffEqn>
                <DiffEqn symbol-ref="E">
                    <Expression> I^p/(I0^p+I^p) - gamma*E </Expression>
                </DiffEqn>
                <DiffEqn symbol-ref="G">
                    <Expression> G0*I^p/(I0^p+I^p) - Kt*G*Rn - gamma*G </Expression>
                </DiffEqn>
                <Rule symbol-ref="colour">
                    <Expression>E/10</Expression>
                </Rule>
            </System>
        </CellType>
        <CellType class="medium" name="medium"/>
    </CellTypes>
    <CPM>
        <Interaction>
            <Contact type1="A" type2="A" value="16.0">
                <HomophilicAdhesion strength="-1.6" adhesive="E"/>
            </Contact>
            <Contact type1="A" type2="medium" value="22.0"/>
            <Contact type1="B" type2="medium" value="22.0"/>
            <Contact type1="A" type2="B" value="16.0">
                <HomophilicAdhesion strength="-1.6" adhesive="E"/>
            </Contact>
            <Contact type1="B" type2="B" value="16.0">
               <HomophilicAdhesion strength="-1.6" adhesive="E"/>
            </Contact>
        </Interaction>
        <MonteCarloSampler stepper="edgelist">
            <!-- cells should be sorted within 24 hrs -->
            <MCSDuration value="0.001"/>
            <Neighborhood>
                <Order>2</Order>
            </Neighborhood>
            <MetropolisKinetics temperature="10"/>
        </MonteCarloSampler>
        <ShapeSurface scaling="norm">
            <Neighborhood>
                <Order>6</Order>
            </Neighborhood>
        </ShapeSurface>
    </CPM>
    <CellPopulations>
        <Population size="0" type="A">
            <InitCircle mode="random" number-of-cells="90">
                <Dimensions radius="size.x/3" center="size.x/2, size.y/2, 0"/>
            </InitCircle>
        </Population>
        <Population size="0" type="B">
            <InitCircle mode="random" number-of-cells="18">
                <Dimensions radius="size.x/3" center="size.x/2, size.y/2, 0"/>
            </InitCircle>
        </Population>
    </CellPopulations>
    <Analysis>
        <Logger time-step="1">
            <Input>
                <Symbol symbol-ref="E"/>
                <Symbol symbol-ref="D"/>
                <Symbol symbol-ref="N"/>
                <Symbol symbol-ref="I"/>
                <Symbol symbol-ref="E"/>
                <Symbol symbol-ref="cell.type"/>
                <Symbol symbol-ref="cell.center.x"/>
                <Symbol symbol-ref="cell.center.y"/>
                <Symbol symbol-ref="Dn"/>
                <Symbol symbol-ref="Nn"/>
            </Input>
            <Output>
                <TextOutput/>
            </Output>
        </Logger>
        <ClusteringTracker time-step="1.0" celltype="B"/>
        <Gnuplotter time-step="1" decorate="false">
            <Terminal size="800 400 0" persist="true" name="png"/>
            <Plot>
                <Cells value="colour" min="-2" max="1.0">
                    <ColorMap>
                        <Color value="-2" color="pink"/>
                        <Color value="-1" color="blue"/>
                        <Color value="0" color="gray"/>
                        <Color value="1" color="green"/>
                     </ColorMap>
                </Cells>
            </Plot>

        </Gnuplotter>
    </Analysis>
</MorpheusModel>
Downloads
Files associated with this model: