One CPM Cell
Persistent Identifier
Use this permanent link to cite or share this Morpheus model:
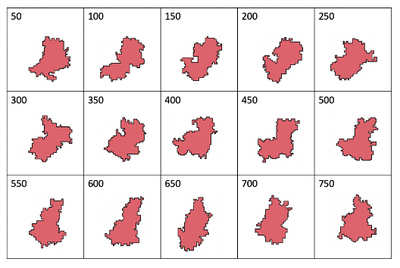
Time sequence showing the changing shape of a CPM cell
Introduction
Not all cell shapes are circular. In this example, a single cell undergoes a whole series of deformations resulting in the development of irregular cell shapes.
Description
For a time sequence showing the shape of a CPM cell every $50$ time-steps the following parameters were used:
- Target area (
VolumeConstraint) $a_0 = 400$,strength$\lambda_a = 1$,
- target perimeter (
SurfaceConstraint) $p_0 = 120$,strength$\lambda_p = 1$,
ConnectivityConstraintenabled,- cell-medium
Contactstrength $ = 2$, temperature$= 1$,yield$= 0.1$.
Results
The cell continuously puts out protrusions in various directions.
OneCPMCell.xmlModel
OneCPMCell.xml
XML Preview
<?xml version='1.0' encoding='UTF-8'?>
<MorpheusModel version="4">
    <Description>
        <Title>One CPM Cell</Title>
        <Details>Full title:		One CPM Cell
Authors:		L. Edelstein-Keshet
Contributors:	Y. Xiao
Date:		02.05.2022
Software:		Morpheus (open-source). Download from https://morpheus.gitlab.io
Model ID:		https://identifiers.org/morpheus/M2002
Reference:		L. Edelstein-Keshet: Mathematical Models in Cell Biology
Comment:		A time sequence showing the shape of a CPM cell every 50 time steps. The cell continuously puts out protrusions in various directions.</Details>
    </Description>
    <Space>
        <Lattice class="square">
            <Size symbol="l" value="150, 150, 0"/>
            <BoundaryConditions>
                <Condition type="constant" boundary="x"/>
                <Condition type="constant" boundary="-x"/>
                <Condition type="constant" boundary="y"/>
                <Condition type="constant" boundary="-y"/>
            </BoundaryConditions>
            <NodeLength value="0.37"/>
            <Neighborhood>
                <Distance>1.5</Distance>
            </Neighborhood>
        </Lattice>
        <SpaceSymbol symbol="space"/>
    </Space>
    <Time>
        <StartTime value="0"/>
        <StopTime symbol="end" value="750"/>
        <TimeSymbol symbol="time"/>
        <RandomSeed value="1227903"/>
    </Time>
    <CellTypes>
        <CellType class="medium" name="medium"/>
        <CellType class="biological" name="amoeba">
            <VolumeConstraint target="400" strength="1"/>
            <SurfaceConstraint target="120" strength="1" mode="surface"/>
            <ConnectivityConstraint/>
        </CellType>
    </CellTypes>
    <CPM>
        <Interaction>
            <Contact type1="amoeba" type2="amoeba" value="4"/>
            <Contact type1="amoeba" type2="medium" value="2"/>
        </Interaction>
        <MonteCarloSampler stepper="edgelist">
            <MCSDuration symbol="MCStime" value="0.1"/>
            <Neighborhood>
                <Order>2</Order>
            </Neighborhood>
            <MetropolisKinetics yield="0.1" temperature="1.0"/>
        </MonteCarloSampler>
        <ShapeSurface scaling="norm">
            <Neighborhood>
                <Distance>1.5</Distance>
            </Neighborhood>
        </ShapeSurface>
    </CPM>
    <CellPopulations>
        <Population type="amoeba" size="1">
            <InitCircle number-of-cells="1" mode="random">
                <Dimensions radius="l.x/8" center="l.x/2, l.y/2, 0"/>
            </InitCircle>
        </Population>
    </CellPopulations>
    <Analysis>
        <Gnuplotter time-step="50" decorate="false">
            <Terminal name="png" size="400 400 0"/>
            <Plot>
                <Cells opacity="0.65" min="0.0" max="10" value="cell.id">
                    <ColorMap>
                        <Color value="1" color="red"/>
                        <Color value="10" color="blue"/>
                    </ColorMap>
                </Cells>
            </Plot>
        </Gnuplotter>
        <ModelGraph format="svg" reduced="false" include-tags="#untagged"/>
    </Analysis>
    <Global/>
</MorpheusModel>

Downloads
Files associated with this model: