Dictyostelium
Persistent Identifier
Use this permanent link to cite or share this Morpheus model:
Introduction
This model show chemotactic aggregation of Dictyostelium. It was constructed by students attending the ECMI modeling week 2012 in Dresden.
Description
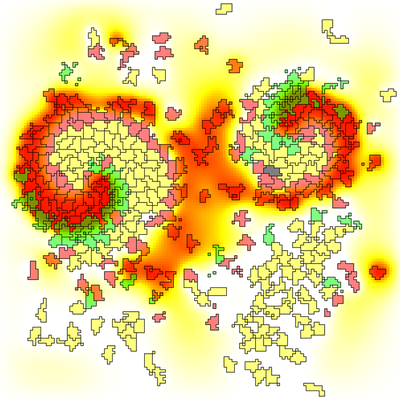
This model shows an interesting coupling between CPM cells and reaction-diffusion PDE. Cell state depends on the perceived concentration of cAMP and determines whether a cell produces cAMP and whether it performs chemotaxis. The PDE is governed by a Fitzhugh-Nagumo-like model of an excitable medium, which causes traveling waves upon excitation. Chemotaxis through those waves causes cell aggregation.
Background colors indicate the cAMP concentration. Cells are color-coded according to their phase:
- excitable/resting (yellow),
- excited/chemotactic (green),
- refractory/resting (red).
Reference
- N. J. Savill, P. Hogeweg: Modelling Morphogenesis: From Single Cells to Crawling Slugs. J. Theor. Biol., 184 (3): 229–235, 1997.
- F. Rost, A. Quintero, M. Myllykoski, A. Igolkina, A. Rohde O’Sullivan Freltoft, N. Dixit: Morphogenesis and Dynamics of Multicellular Systems. ECMI Newsletter 52, 2012.
Model
Examples → Multiscale → Dictyostelium.xml or
Dictyostelium.xml
XML Preview
<?xml version='1.0' encoding='UTF-8'?>
<MorpheusModel version="3">
<Description>
<Title>Example-Dictyostelium</Title>
<Details>Aggregation of dictyostelium by chemotactic amoeba as excitable medium mediated by diffusive cAMP signal.
Original reference:
- Nicholas Savill and Paulien Hogeweg, Modelling morphogenesis: from single cells to crawling slugs, J. Theo. Biol., 1997.
Morpeus implementation by ECMI 2012 summer course:
- A. Quintero, M. Myllykoski, A. Igolkina, A. Freltoft, N. Dixit, F. Rost, Morphogenesis and Dynamics of Multicellular Systems, ECMI Newletter 52, 2012.</Details>
</Description>
<Global>
<Field symbol="c" value="0" name="cAMP">
<Diffusion rate="1"/>
<BoundaryValue boundary="x" value="0"/>
<BoundaryValue boundary="-x" value="0"/>
<BoundaryValue boundary="y" value="0"/>
<BoundaryValue boundary="-y" value="0"/>
</Field>
<Field symbol="r" value="0" name="refractoriness">
<Diffusion rate="0"/>
<BoundaryValue boundary="x" value="0"/>
<BoundaryValue boundary="-x" value="0"/>
<BoundaryValue boundary="y" value="0"/>
<BoundaryValue boundary="-y" value="0"/>
</Field>
<System solver="euler" time-step="0.1">
<Constant symbol="c1" value="0.0065"/>
<Constant symbol="c2" value="0.841"/>
<DiffEqn symbol-ref="c">
<Expression>is_amoeba*(-f() -r)</Expression>
</DiffEqn>
<DiffEqn symbol-ref="r">
<Expression>is_amoeba*epsilon()*(3.5*c-b-r)</Expression>
</DiffEqn>
<Function symbol="epsilon">
<Expression>if(c < c1, 0.5,
if(c < c2, 0.0589,
0.5))</Expression>
</Function>
<Function symbol="f">
<Expression>if(c < c1, 20*c,
if(c < c2, -3*c+0.15,
15*(c-1)))</Expression>
<!-- <Disabled>
<Expression>-3*c</Expression>
</Disabled>
-->
</Function>
</System>
</Global>
<Space>
<Lattice class="square">
<Size symbol="l" value="150 150 0"/>
<BoundaryConditions>
<Condition boundary="x" type="constant"/>
<Condition boundary="-x" type="constant"/>
<Condition boundary="y" type="constant"/>
<Condition boundary="-y" type="constant"/>
</BoundaryConditions>
<NodeLength value="0.37"/>
<Neighborhood>
<Distance>1.5</Distance>
</Neighborhood>
</Lattice>
<SpaceSymbol symbol="space"/>
</Space>
<Time>
<StartTime value="0"/>
<StopTime symbol="end" value="750"/>
<TimeSymbol symbol="time"/>
<RandomSeed value="1357906713"/>
</Time>
<CellTypes>
<CellType class="medium" name="medium">
<Property symbol="b" value="0"/>
<Property symbol="max_c" value="0"/>
<Property symbol="phase" value="0"/>
<Property symbol="is_amoeba" value="0"/>
</CellType>
<CellType class="biological" name="amoeba">
<VolumeConstraint target="40" strength="1"/>
<Chemotaxis field="c" strength="mu"/>
<Property symbol="is_amoeba" value="1.0"/>
<Property symbol="b" value="0"/>
<Property symbol="max_c" value="0"/>
<Property symbol="phase" value="1"/>
<Property symbol="phaseTime" value="0"/>
<Property symbol="phase2duration" value="0.1"/>
<Function symbol="mu">
<Expression>if(phase == 2, 10, 0)</Expression>
</Function>
<System solver="heun" time-step="1.0">
<Rule symbol-ref="phaseTime">
<Expression>if(phase == 2, phaseTime+MCStime, 0)</Expression>
</Rule>
<Rule symbol-ref="phase" name="Rule_2_3">
<Expression>if(phase == 1 and max_c > 0.1, 2,
if(phase == 2 and phaseTime>phase2duration, 3,
if(phase == 3 and max_c < 0.05, 1,
phase
))) </Expression>
</Rule>
</System>
<Mapper>
<Input value="c"/>
<Output symbol-ref="max_c" mapping="maximum"/>
</Mapper>
</CellType>
<CellType class="biological" name="autoAmoeba">
<VolumeConstraint target="40" strength="1"/>
<Property symbol="b" value="0.5"/>
<Property symbol="max_c" value="0"/>
<Property symbol="phase" value="0"/>
<Property symbol="is_amoeba" value="1.0"/>
</CellType>
</CellTypes>
<CPM>
<Interaction>
<Contact type1="amoeba" type2="amoeba" value="4"/>
<Contact type1="amoeba" type2="medium" value="2"/>
<Contact type1="amoeba" type2="autoAmoeba" value="4"/>
<Contact type1="autoAmoeba" type2="medium" value="3"/>
</Interaction>
<MonteCarloSampler stepper="edgelist">
<MCSDuration symbol="MCStime" value="0.5"/>
<Neighborhood>
<Order>2</Order>
</Neighborhood>
<MetropolisKinetics temperature="1.0" yield="0.1"/>
</MonteCarloSampler>
<ShapeSurface scaling="norm">
<Neighborhood>
<Distance>1.5</Distance>
</Neighborhood>
</ShapeSurface>
</CPM>
<CellPopulations>
<Population size="1" type="autoAmoeba">
<InitRectangle mode="regular" number-of-cells="1">
<Dimensions size="10, 10, 0" origin="l.x/2, l.y/2, 0"/>
</InitRectangle>
</Population>
<Population size="1" type="amoeba">
<InitRectangle mode="regular" number-of-cells="250">
<Dimensions size="l.x-6,l.y-6,1" origin="3,3,0"/>
</InitRectangle>
</Population>
</CellPopulations>
<Analysis>
<Gnuplotter time-step="5" decorate="false">
<Terminal opacity="0.65" size="400 400 0" name="png"/>
<Plot>
<Field symbol-ref="c" min="0" max="1.0">
<ColorMap>
<Color value="0" color="white"/>
<Color value="0.5" color="yellow"/>
<Color value="1.0" color="red"/>
</ColorMap>
</Field>
<Cells value="phase" min="0" max="3">
<ColorMap>
<Color value="0" color="black"/>
<Color value="1" color="yellow"/>
<Color value="2" color="green"/>
<Color value="3" color="red"/>
</ColorMap>
</Cells>
</Plot>
</Gnuplotter>
<DependencyGraph format="svg" exclude-plugins="Gnuplotter"/>
</Analysis>
</MorpheusModel>
Downloads
Files associated with this model: