Persistence
Persistent Identifier
Use this permanent link to cite or share this Morpheus model:
Introduction
This example shows self-organized collective motion of cells as a result of persistence (‘cellular inertia’). A similar model has recently been used by Czirók et al. (2013).
Description
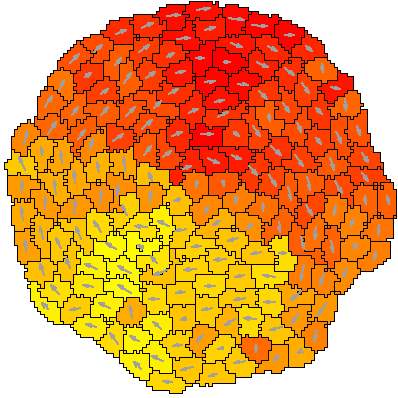
The model uses the Persistence plugin that causes cells to prefer to move in their current direction. The direction is stored in a PropertyVector that is used to plot the color and arrows in Gnuplotter.
The model is simulated in a circular domain with constant boundary conditions, which can be set up in Lattice/Domain/Circle. The value for the constant boundary is specified in CPM/BoundaryValue.
Things to try
- Place static obstacles on the lattice and observe the flow pattern around the obstacle(s). The model included in the Morpheus-GUI has a corresponding
CellTypeobstacle defined and already initializes a rectangular obstacle. To obtain the symmetric circular flow pattern in the video above, simply disable the initialization of the obstacle underCellPopulations. - Change the boundary conditions from
circular$\ = \ $constantto $x/y = \ $periodicand observe the resulting collective motion. - Change the
decay-timeofPersistence(specifying the ‘memory’).
Reference
A. Czirók, K. Varga, E. Méhes, A. Szabó: Collective cell streams in epithelial monolayers depend on cell adhesion. New J. Phys. 15 (7): 075006, 2013.
Model
Examples → CPM → Persistence_2D.xml or
Persistence_2D.xml
XML Preview
<MorpheusModel version="3">
    <Description>
        <Title>Example-Persistence</Title>
        <Details></Details>
    </Description>
    <Global>
        <VariableVector symbol="d" value="0.0, 0.0, 0.0" name="Moving direction"/>
        <Constant symbol="density" value="0.012"/>
    </Global>
    <Space>
        <Lattice class="square">
            <Size symbol="size" value="200, 200, 0"/>
            <Neighborhood>
                <Order>2</Order>
            </Neighborhood>
            <Domain boundary-type="constant">
                <Circle diameter="200"/>
            </Domain>
        </Lattice>
        <SpaceSymbol symbol="space"/>
    </Space>
    <Time>
        <TimeSymbol symbol="time"/>
        <StartTime value="0"/>
        <StopTime value="5000"/>
        <RandomSeed value="4"/>
    </Time>
    <CellTypes>
        <CellType class="biological" name="obstacle">
            <FreezeMotion>
                <Condition>1</Condition>
            </FreezeMotion>
        </CellType>
        <CellType class="biological" name="ct1">
            <PropertyVector symbol="d" value="0.0, 0.0, 0.0" name="Moving direction"/>
            <Property symbol="s" value="5"/>
            <VolumeConstraint target="100" strength="1"/>
            <SurfaceConstraint target="0.9" mode="aspherity" strength="1"/>
            <PersistentMotion protrusion="true" decay-time="50" strength="s"/>
            <MotilityReporter time-step="50">
                <Velocity symbol-ref="d"/>
            </MotilityReporter>
        </CellType>
        <CellType class="medium" name="medium"/>
    </CellTypes>
    <CPM>
        <Interaction>
            <Contact type1="ct1" type2="medium" value="16"/>
            <Contact type1="ct1" type2="ct1" value="1"/>
        </Interaction>
        <MonteCarloSampler stepper="edgelist">
            <MCSDuration value="1"/>
            <Neighborhood>
                <Order>2</Order>
            </Neighborhood>
            <MetropolisKinetics temperature="10"/>
        </MonteCarloSampler>
        <ShapeSurface scaling="norm">
            <Neighborhood>
                <Distance>3</Distance>
            </Neighborhood>
        </ShapeSurface>
    </CPM>
    <CellPopulations>
        <Population size="1" type="obstacle">
            <InitCellObjects mode="distance">
                <Arrangement repetitions="1, 1, 1" displacements="1, 1, 1">
                    <Box size="20,30,0" origin="130,100,0"/>
                </Arrangement>
            </InitCellObjects>
        </Population>
        <Population size="0" type="ct1">
            <InitCircle mode="regular" number-of-cells="400">
                <Dimensions radius="100" center="100, 100, 0"/>
            </InitCircle>
        </Population>
    </CellPopulations>
    <Analysis>
        <Gnuplotter time-step="100">
            <Terminal size="1000 600 0" name="png"/>
            <Plot>
                <Cells value="cell.id"/>
                <!--    <Disabled>
        <CellArrows style="1" orientation="3 * d / d.abs"/>
    </Disabled>
-->
            </Plot>
            <Plot>
                <Cells value="d.phi" min="0.0" max="6.28">
                    <ColorMap>
                        <Color value="6.28" color="red"/>
                        <Color value="3.14" color="blue"/>
                        <Color value="0.0" color="red"/>
                    </ColorMap>
                </Cells>
                <CellArrows style="1" orientation="3 * d / d.abs"/>
            </Plot>
        </Gnuplotter>
        <Logger time-step="10">
            <Input>
                <Symbol symbol-ref="cell.center.x"/>
                <Symbol symbol-ref="cell.center.y"/>
            </Input>
            <Output>
                <TextOutput file-separation="cell"/>
            </Output>
            <Plots>
                <Plot time-step="50">
                    <Style style="lines" line-width="2.0"/>
                    <Terminal terminal="png"/>
                    <X-axis minimum="0.0" maximum="size.x">
                        <Symbol symbol-ref="cell.center.x"/>
                    </X-axis>
                    <Y-axis minimum="0.0" maximum="size.y">
                        <Symbol symbol-ref="cell.center.y"/>
                    </Y-axis>
                    <Color-bar>
                        <Symbol symbol-ref="time"/>
                    </Color-bar>
                    <Range>
                        <Time mode="history" history="50"/>
                    </Range>
                </Plot>
            </Plots>
        </Logger>
    </Analysis>
</MorpheusModel>
Downloads
Files associated with this model: