Spatial Parameter Sweep: Turing Patterns
Persistent Identifier
Use this permanent link to cite or share this Morpheus model:
Introduction
This model shows the pattern formation abilities of Turing’s linear activator-inhibitor model (Miyazawa et al., 2010). It shows how to vary parameters as a function of space.

Description
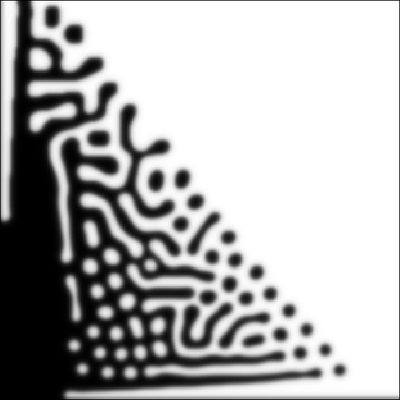
Instead of fixed parameters defined as Constants, this model uses Functions for two parameters. The parameters $C$ (activator production) and $A$ (rate of auto-activation) are defined as Function of space and varied over the $x$- and $y$-axes respectively. This requires the definition of a SpaceSymbol that can be used in expressions.
The results show the appearance of white spots (left), black spots (right) and labyrinthine patterns (middle).
Reference
S. Miyazawa, M. Okamoto, S. Kondo: Blending of animal colour patterns by hybridization. Nat. Commun. 1 (6): 66, 2010.
Model
Examples → PDE → TuringPatterns.xml or
TuringPatterns.xml
XML Preview
<MorpheusModel version="3">
    <Description>
        <Title>Example-TuringPatterns</Title>
        <Details>
Miyazawa, Okamoto and Kondo, Blending of animal colour patterns by hybridization, Nature Communications, 2010</Details>
    </Description>
    <Global>
        <Field symbol="u" value="4.1+rand_uni(0,1)">
            <Diffusion rate="1"/>
        </Field>
        <Field symbol="v" value="4.84+rand_uni(0,1)">
            <Diffusion rate="20"/>
        </Field>
        <System solver="runge-kutta" time-step="0.25" name="Miyazawa">
            <Function symbol="A">
                <Expression>0.07 + ((0.07 * l.y)/ s.y)</Expression>
            </Function>
            <Constant symbol="B" value="0.08"/>
            <Function symbol="C">
                <Expression>-0.1 + ((0.5 * l.x)/ s.x)</Expression>
            </Function>
            <Constant symbol="D" value="0.03"/>
            <Constant symbol="E" value="0.10"/>
            <Constant symbol="F" value="0.12"/>
            <Constant symbol="G" value="0.06"/>
            <Constant symbol="R" value="20.0"/>
            <Constant symbol="synU_max" value="0.23"/>
            <Constant symbol="synV_max" value="0.50"/>
            <Function symbol="s_u">
                <Expression>max( 0, min( synU_max, A()*u-B*v+C()))</Expression>
            </Function>
            <Function symbol="s_v">
                <Expression>max( 0, min( synV_max, E*u - F))</Expression>
            </Function>
            <DiffEqn symbol-ref="u">
                <Expression>R*(s_u() - D*u)</Expression>
            </DiffEqn>
            <DiffEqn symbol-ref="v">
                <Expression>R*(s_v() - G*v)</Expression>
            </DiffEqn>
        </System>
    </Global>
    <Space>
        <Lattice class="square">
            <Size symbol="s" value="512 512 0"/>
            <NodeLength value="1"/>
            <BoundaryConditions>
                <Condition boundary="x" type="noflux"/>
                <Condition boundary="y" type="noflux"/>
            </BoundaryConditions>
            <Neighborhood>
                <Order>1</Order>
            </Neighborhood>
        </Lattice>
        <SpaceSymbol symbol="l"/>
    </Space>
    <Time>
        <StartTime value="0"/>
        <StopTime value="30"/>
        <SaveInterval value="0"/>
        <RandomSeed value="1"/>
        <TimeSymbol symbol="time"/>
    </Time>
    <Analysis>
        <Gnuplotter time-step="2" decorate="false">
            <Terminal persist="true" name="png"/>
            <Plot>
                <Field symbol-ref="u">
                    <ColorMap>
                        <Color value="1" color="black"/>
                        <Color value="0.0" color="white"/>
                    </ColorMap>
                </Field>
            </Plot>
        </Gnuplotter>
        <Logger time-step="0.0">
            <Input>
                <Symbol symbol-ref="u"/>
            </Input>
            <Output>
                <TextOutput file-format="csv"/>
            </Output>
            <Restriction>
                <Slice value="s.x/2" axis="x"/>
            </Restriction>
            <Plots>
                <Plot title="slice at half of x extension" time-step="-1">
                    <Style style="lines" line-width="3.0"/>
                    <Terminal terminal="png"/>
                    <X-axis>
                        <Symbol symbol-ref="l.y"/>
                    </X-axis>
                    <Y-axis>
                        <Symbol symbol-ref="u"/>
                    </Y-axis>
                    <Color-bar>
                        <Symbol symbol-ref="v"/>
                    </Color-bar>
                </Plot>
            </Plots>
        </Logger>
        <Logger time-step="2">
            <Input>
                <Symbol symbol-ref="u"/>
            </Input>
            <Output>
                <TextOutput file-format="csv"/>
            </Output>
            <Plots>
                <SurfacePlot time-step="2">
                    <Color-bar>
                        <Symbol symbol-ref="u"/>
                    </Color-bar>
                    <Terminal terminal="png"/>
                </SurfacePlot>
            </Plots>
        </Logger>
    </Analysis>
</MorpheusModel>
Downloads
Files associated with this model: