Coupled ODE Lattice: Lateral Signaling
Persistent Identifier
Use this permanent link to cite or share this Morpheus model:
Introduction
This example model cell fate decisions during early patterning of the pancreas (de Back et al., 2012). The simple gene regulatory network of each cell is coupled to adjacent cells by lateral (juxtacrine) signaling.
Description
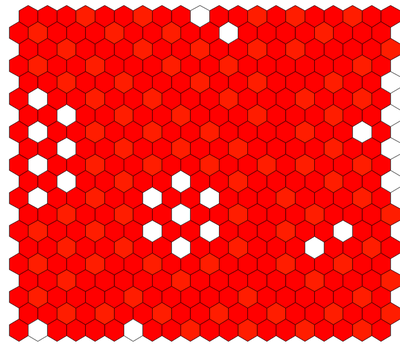
The model defines a lattice of cells with a simplified hexagonal epithelial packing. This is specified in Space using a hexagonal lattice structure of Size $(x,y,z)=(20,20,0)$ with periodic BoundaryConditions. The lattice is filled by seeding it with a Population of 400 cells.
Each cell has two basic Properties $X$ and $Y$ representing the expression levels of $\mathrm{Ngn3}$ and $\mathrm{Ptf1a}$ that are coupled in a System of DiffEqns.
The NeighborhoodReporter plugin is used to couple the cells to their directly adjacent neighbors. This plugin checks the values of $X$ in neighboring cells and outputs its mean value in Property $X_n$.
This model uses a number of Analysis plugins:
- The
Gnuplottervisualizes the values of $Y$ with aColorMapthat maps values to colors. It outputs to screen (interactive mode) or to PNG (local mode). - The
Loggerrecords the values of $X$ and $Y$ expression to file and, at the end of simulation, shows a time plot. - The first
HistogramLoggerrecords and plots the distribution of $X$ and $Y$ expression cells over time. - The second
HistogramLoggerrecords and, after simulation, plots the distribution of $\tau$, the time to cell fate decision (see reference).
Things to try
- Change the lattice structure from
hexagonaltosquare. SeeSpace/Lattice. - Change the strength of lateral stabilization
band observe the pattern. SeeCellTypes/CellType/System. - Change the
noiseamplitude (underCellTypes/CellType/System) and observe time $\tau$ to cell fate decision.
Reference
W. de Back, J. X. Zhou, L. Brusch: On the Role of Lateral Stabilization during Early Patterning in the Pancreas. J. R. Soc. Interface 10 (79): 20120766, 2013.
Model
Examples → ODE → LateralSignaling.xml or
LateralSignaling.xml
XML Preview
<?xml version='1.0' encoding='UTF-8'?>
<MorpheusModel version="3">
    <Description>
        <Title>Example-LateralSignaling</Title>
        <Details>Reference:

Walter de Back, Joseph X. Zhou, Lutz Brusch, On the Role of Lateral Stabilization during Early Patterning in the Pancreas, Roy. Soc. Interface 10(79): 20120766, 2012.

http://dx.doi.org/10.1098/rsif.2012.0766
</Details>
    </Description>
    <Global>
        <Constant symbol="X" value="0"/>
        <Constant symbol="Y" value="0"/>
    </Global>
    <Space>
        <Lattice class="hexagonal">
            <Size symbol="size" value="20 20 0"/>
            <BoundaryConditions>
                <Condition boundary="x" type="periodic"/>
                <Condition boundary="y" type="periodic"/>
            </BoundaryConditions>
            <Neighborhood>
                <Order>1</Order>
            </Neighborhood>
        </Lattice>
        <SpaceSymbol symbol="space"/>
    </Space>
    <Time>
        <StartTime value="0"/>
        <StopTime value="30"/>
        <TimeSymbol symbol="t"/>
        <!--    <Disabled>
        <RandomSeed value="2"/>
    </Disabled>
-->
    </Time>
    <CellTypes>
        <CellType class="biological" name="cells">
            <Property symbol="X" value="0.0" name="Ngn3"/>
            <Property symbol="Xn" value="0.0" name="Ngn3-Neighbors"/>
            <Property symbol="Y" value="0" name="Ptf1a"/>
            <Property symbol="Yn" value="0" name="Ptf1a-neighbors"/>
            <System solver="heun" time-step="0.02">
                <Constant symbol="a" value="1"/>
                <Constant symbol="b" value="21"/>
                <Constant symbol="c" value="1"/>
                <DiffEqn symbol-ref="X">
                    <Expression>((th / (th + a*Xn^n)) - X) + rand_norm(0.0,noise)</Expression>
                </DiffEqn>
                <DiffEqn symbol-ref="Y">
                    <Expression>(((th + b*(Y * Yn)^n) / (th + c*X^n + b*(Y * Yn)^n))  - Y ) + rand_norm(0.0,noise)</Expression>
                </DiffEqn>
                <Constant symbol="n" value="4"/>
                <Constant symbol="th" value="1e-4"/>
                <Constant symbol="noise" value="1e-4"/>
            </System>
            <NeighborhoodReporter>
                <Input scaling="cell" value="X"/>
                <Output symbol-ref="Xn" mapping="average"/>
            </NeighborhoodReporter>
            <NeighborhoodReporter>
                <Input scaling="cell" value="Y"/>
                <Output symbol-ref="Yn" mapping="average"/>
            </NeighborhoodReporter>
            <Event trigger="on change">
                <Condition>tau == -1 and (X-Xn) > 0.05</Condition>
                <Rule symbol-ref="tau">
                    <Expression>t</Expression>
                </Rule>
            </Event>
            <Property symbol="tau" value="-1" name="time to cell fate decision"/>
        </CellType>
    </CellTypes>
    <CellPopulations>
        <Population size="0" type="cells">
            <InitCellLattice/>
        </Population>
    </CellPopulations>
    <Analysis>
        <Gnuplotter time-step="5">
            <Terminal size="800 400 0" persist="true" name="png"/>
            <Plot>
                <Cells value="X" min="0.0" max="1">
                    <ColorMap>
                        <Color value="1.0" color="blue"/>
                        <Color value="0.5" color="light-blue"/>
                        <Color value="0.0" color="white"/>
                    </ColorMap>
                </Cells>
            </Plot>
            <Plot>
                <Cells value="Y" min="0.0" max="1">
                    <ColorMap>
                        <Color value="1.0" color="red"/>
                        <Color value="0.5" color="light-red"/>
                        <Color value="0.0" color="white"/>
                    </ColorMap>
                </Cells>
            </Plot>
        </Gnuplotter>
        <Logger time-step="0.1">
            <Input>
                <Symbol symbol-ref="X"/>
                <Symbol symbol-ref="Y"/>
            </Input>
            <Output>
                <TextOutput file-separation="cell"/>
            </Output>
            <Plots>
                <Plot time-step="-1">
                    <Style style="lines" line-width="2"/>
                    <Terminal terminal="png"/>
                    <X-axis>
                        <Symbol symbol-ref="t"/>
                    </X-axis>
                    <Y-axis>
                        <Symbol symbol-ref="X"/>
                    </Y-axis>
                    <Color-bar>
                        <Symbol symbol-ref="Y"/>
                    </Color-bar>
                    <Range>
                        <Data increment="3"/>
                    </Range>
                </Plot>
            </Plots>
        </Logger>
        <HistogramLogger minimum="-0.1" normalized="true" maximum="1.1" time-step="5" number-of-bins="20">
            <Plot minimum="0" maximum="1.0" terminal="png"/>
            <Column symbol-ref="X" celltype="cells"/>
            <Column symbol-ref="Y" celltype="cells"/>
        </HistogramLogger>
        <HistogramLogger minimum="0.0" normalized="true" maximum="30" time-step="-1" number-of-bins="30">
            <Plot minimum="0" maximum="1.0" terminal="png"/>
            <Column symbol-ref="tau" celltype="cells"/>
        </HistogramLogger>
    </Analysis>
</MorpheusModel>
Downloads
Files associated with this model: