1D Reaction-Diffusion: Activator-Inhibitor
Persistent Identifier
Use this permanent link to cite or share this Morpheus model:
Introduction
The first example models a 1D activator-inhibitor model (Gierer and Meinhardt, 1972).
Description
This 1D PDE model uses a Lattice with linear structure and periodic boundary conditions.
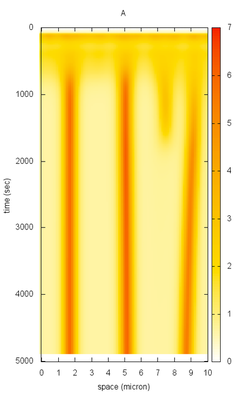
The PDE defined two species called Layers: $A$ (activator) and $I$ (inhibitor) with resp. low and high Diffusion rates. The reaction part of the equations are defined in the System. Similar to ODE model, the System defines Constants and DiffEqns.
The results are recorded and visualized using the Logger and SpaceTimeLogger.
Reference
A. Gierer, H. Meinhardt: A Theory of Biological Pattern Formation. Kybernetik 12: 30-39, 1972.
Model
Examples → PDE → ActivatorInhibitor_1D.xml or
ActivatorInhibitor_1D.xml
XML Preview
<MorpheusModel version="3">
    <Description>
        <Title>Example-ActivatorInhibitor1D</Title>
        <Details></Details>
    </Description>
    <Global>
        <Field symbol="a" value="rand_norm(0.5,0.1)" name="activator">
            <Diffusion rate="0.02"/>
        </Field>
        <Field symbol="i" value="0.1" name="inhibitor">
            <Diffusion rate="1"/>
        </Field>
        <System solver="runge-kutta" time-step="1">
            <DiffEqn symbol-ref="a">
                <Expression>(rho*a^2) / i - mu_a * a + rho_a</Expression>
            </DiffEqn>
            <DiffEqn symbol-ref="i">
                <Expression>(rho*a^2) - mu_i * i</Expression>
            </DiffEqn>
            <Constant symbol="rho_a" value="0.01"/>
            <Constant symbol="mu_i" value="0.03"/>
            <Constant symbol="mu_a" value="0.02"/>
            <Constant symbol="rho" value="0.001"/>
        </System>
    </Global>
    <Space>
        <Lattice class="linear">
            <Size symbol="size" value="100 0 0"/>
            <BoundaryConditions>
                <Condition boundary="x" type="periodic"/>
            </BoundaryConditions>
            <NodeLength value="0.25"/>
            <Neighborhood>
                <Order>1</Order>
            </Neighborhood>
        </Lattice>
        <SpaceSymbol symbol="space"/>
    </Space>
    <Time>
        <StartTime value="0"/>
        <StopTime value="4000"/>
        <SaveInterval value="0"/>
        <!--    <Disabled>
        <RandomSeed value="1"/>
    </Disabled>
-->
        <TimeSymbol symbol="time"/>
    </Time>
    <Analysis>
        <Logger time-step="25">
            <Input>
                <Symbol symbol-ref="a"/>
                <Symbol symbol-ref="i"/>
            </Input>
            <Output>
                <TextOutput/>
            </Output>
            <Plots>
                <Plot time-step="250" title="space plot">
                    <Style style="lines" line-width="3.0"/>
                    <Terminal terminal="png"/>
                    <X-axis>
                        <Symbol symbol-ref="space.x"/>
                    </X-axis>
                    <Y-axis minimum="0" maximum="3.5">
                        <Symbol symbol-ref="a"/>
                        <Symbol symbol-ref="i"/>
                    </Y-axis>
                    <Range>
                        <Time mode="current"/>
                    </Range>
                </Plot>
                <Plot time-step="-1" title="time-space plot">
                    <Style style="points"/>
                    <Terminal terminal="png"/>
                    <X-axis>
                        <Symbol symbol-ref="time"/>
                    </X-axis>
                    <Y-axis>
                        <Symbol symbol-ref="space.x"/>
                    </Y-axis>
                    <Color-bar>
                        <Symbol symbol-ref="a"/>
                    </Color-bar>
                </Plot>
            </Plots>
        </Logger>
    </Analysis>
</MorpheusModel>
Downloads
Files associated with this model: