Exporting the Divisional History
Let’s assume you have a CPM model set up with dividing cells. (If not, have a look at the Examples/CPM/Proliferation_2D.xml example model.) In this case, you will be familiar with the CellType plugin CellDivision. This allows you to specify the conditions under which cell division occurs.
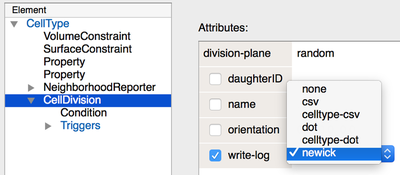
However, you may have missed the write-log option in the attribute of the CellDivision plugin. This feature allows you to record and export the divisional history of the cell in your simulation.
Division plugin provide a write-log tool to export the divisional history in various formats.
Check out Proliferation_2D.xml to try yourself via:
- Morpheus Link or
- Morpheus GUI:
Examples→CPM→Proliferation_2D.xmlor - Morpheus Model Repository.
The write-log feature supports several formats to export this information, discussed below:
- CSV format
- Dot format
- Newick format
CSV format
The CSV format writes the divisional history in a tab-delimited text file where each line represent a cell division event and the columns represent:
- the time of cell division
- cell id of the mother cell
- cell id of one daughter cell
- cell id of the other daughter cell
An example is shown below:
Time        MotherID	Daughter1ID	Daughter2ID
71	    1	        2	        3
123	    3	        4	        5
145	    5	        6	        7
171	    2	        8	        9
173	    4	        10	        11
176	    8	        12	        13
200	    7	        14	        15
The CSV format is the most verbose format and the only one that provides the time stamp of the cell division events. However, it is not a standardized format or a specifically designed to represent trees. Therefore, using this format to visualize or analyse the tree structure will take some additional work.
Dot format
The dot format is a well-known format to describe generic graphs, thus including trees, and can be visualized using programs such as GraphViz.
The dot format does not provide information on the time of cell division but simply lists the edges of the tree. For instance, if a the mother cell with id 1 had two daughter cells with id’s 2 and 3, this will be represented as:
1 -> 2
1 -> 3
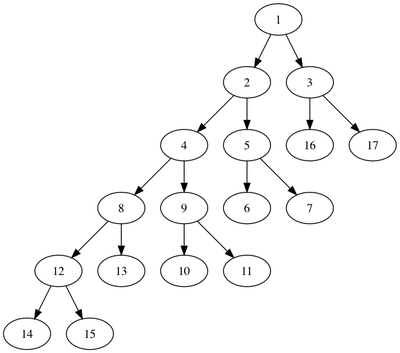
A full cell division history file in dot format may look like this:
digraph{
1 -> 2
1 -> 3
2 -> 4
2 -> 5
5 -> 6
5 -> 7
4 -> 8
4 -> 9
9 -> 10
9 -> 11
8 -> 12
8 -> 13
12 -> 14
12 -> 15
3 -> 16
3 -> 17
}
} is only created when finishing the simulation. If you stop the simulation prematurely, you may need to add it yourself.
To visualize the tree, you can use the GraphViz utility dot and create a PNG image like this:
dot -Tpng cell_division.dot > cell_division.png
While useful, the dot format is not a tree-specific format and is designed for graphs rather than trees.
celltype-csv or celltype-dot formats to obtain separate divisional history files for each cell type.
Newick format
The Newick format, also known as the New Hampshire tree format, is a way to specifically represent trees using parentheses and commas. It has been adopted by many software tools for phylogenetic analysis such as PHYLIP.
The simplest version of the Newick format uses only parentheses and commas, with a semicolon as stop symbol, to describe the tree topology, e.g. ((,),(,));. Trees are represented by a single line of text, independent of the size of the tree.
Morpheus used a slight more elaborate Newick format (called format 8) with names for all the leaves as well as the internal nodes like this:
((("6","7")"4",("8",("10","11")"9")"5")"2",("12","13")"3")"1";
Here, the root of the tree ("1") is shown to the right. If you puzzle a little, you will see that one of its children ("3") has divided only once (daughters called "12" and "13") while its other daughter ("2") has left more progeny.
We will stick with the Newick format and visualize it using the python package ETE3.